Project-Level Measures
Public Space & Street Life
Accessibility, connectivity, and vibrancy are requirements for a well-functioning urban environment. GSI projects can contribute to the creation of a cohesive and legible streetscape and safe, beautiful public spaces.
Conduct intercept surveys of people walking, bicycling, and sitting in public spaces to gather qualitative data about their perceptions and experiences of safety, happiness, stress, and well-being. Use metrics like the gender ratio of bicyclists or the ratio of children and seniors to young adults to evaluate comfort for all ages and abilities.
Cities are thirsting for public space. Measure acreage or square feet of space reclaimed from car-only street space. Even hardscape, if relevant for public life and activity, is valuable square footage.
Measure public life before and after project implementation and use before/after photography to document changes. To evaluate projects systemactically, compare project data with comparison corridors for a control case. Before/after data and photographs, as well as comparative studies, are critical tools for project evaluation and case-making for future projects.
Measure human activity in public spaces through public life canvassing. Count people using the street for stationary activities in a series of walk-through “snapshots” of a space.
Economic Benefits
Green infrastructure investments provide economic benefits to surrounding households, businesses, and communities.
Though GSI projects can improve adjacent property values, it can be difficult to collect adequate sample of data to be more than anecdotal. Include community members and residents throughout the design process to ensure GSI projects meet community needs and are not perceived as a tool for displacement, especially among renters who may not accrue the benefits of increased property values.
Use metrics like retail and residential occupancy/vacancy rates and sales tax revenue for local businesses along the project corridor. Conduct intercept surveys of customers visiting businesses to demonstrate approximate value of purchases made or the number of potential customers visiting the store.1
Green infrastructure projects and programs create stable, localized jobs ranging from construction to landscaping and maintenance to monitoring and performance management. Count direct green industry jobs created by city projects or programs, and estimate indirect and induced jobs created by program expansion.
GSI projects, especially those with shade trees, can reduce building energy demand.2 Measure energy consumption before and after project implementation, and continue to measure over time as trees mature and provide more shade.
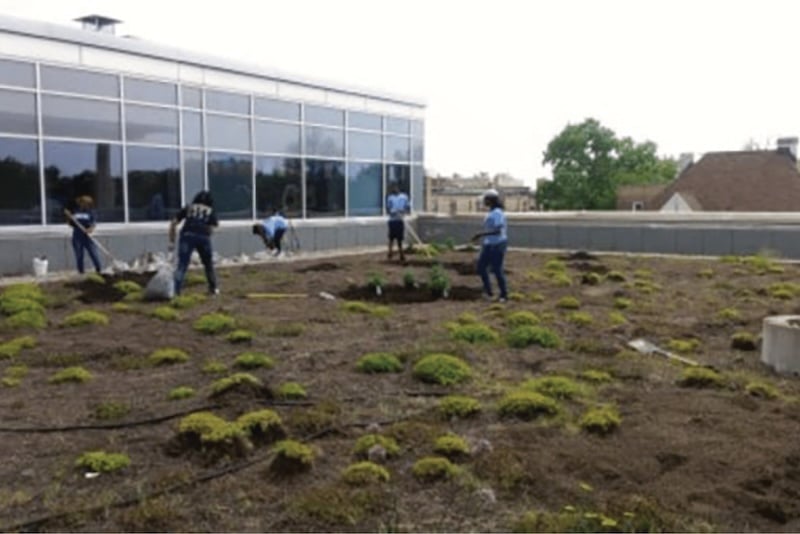
Chicago, IL
The City of Chicago’s Greencorps is a nine-month program that offers full-time employment, job training and skill development, and professional networking opportunities for residents who face barriers to employment. Greencorps members assist with green infrastructure maintenance while preparing for green industry careers. In the first 16 years of the program, 75% of program graduates proceeded to employment or advanced positions with Greencorps.3
Program-Level Measures
Heat Island Effect
Urban heat islands, which can be significantly warmer than surrounding rural areas, are linked with an increase in heat-related illnesses. The urban heat island effect also drives an increase in energy demand for air conditioning, thereby increasing energy bills and energy-related greenhouse gas emissions.4 The urban heat island effect occurs in dense areas with high percentages of land cover that absorb or hold heat, such as pavement, buildings, or other hardscape.
Temperature data is not a direct indicator of GSI performance, but can provide clues to inform future GSI system designs to better reduce local temperatures through evapotranspiration and shading.
Measuring reductions in the urban heat island effect requires a combination of techniques, including measuring the energy reflected and emitted from various surfaces in cities, as well as air temperature measurements.
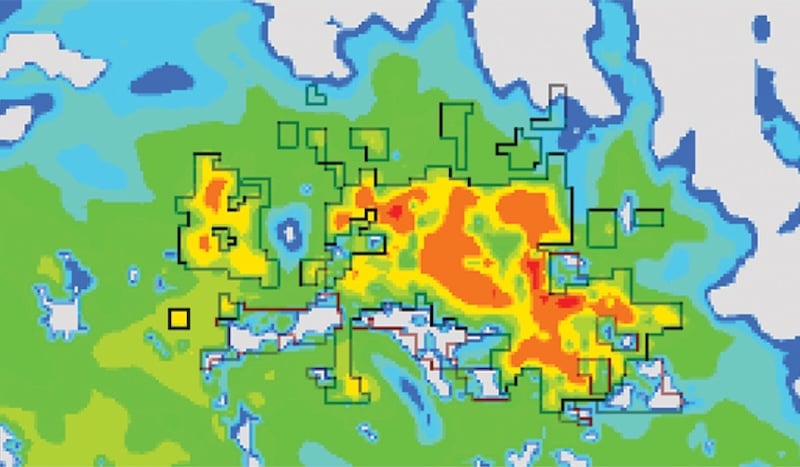
Phoenix, AZ
Phoenix, which has a dramatic urban heat island effect resulting in city temperatures that are 15 degrees warmer than adjacent desert and farmland, charted an ambitious roadmap to plant urban forests and street trees. Phoenix aims to achieve an average 25% shade canopy coverage for the entire city by 2030 as part of a strategy to address the urban heat island effect, decrease energy consumption and costs, reduce stormwater runoff, and contribute to a more pleasant public realm.5
Public Health
Greening in urban environments has been attributed to improving mental, physical, and social well-being.
Water quality improvement is usually the most significant and directly observable public health benefit from green infrastructure programs. Measuring reductions in combined sewer outfall events, as well as the presence of pollutants, harmful bacteria, and metals in regional surface and groundwater are basic components for monitoring and communicating program efficacy.
Air quality is also readily measurable in the urban environment; trees and vegetation absorb air pollutants and intercept particulate matter from the atmosphere that cause chronic diseases such as asthma. Measure indicators in the atmosphere such as nitrogen dioxide and street-level particulate matter.
Cities can work with institutions or public health researchers to understand the diverse human impacts of greened streets. Monitoring changes to asthma rates and heat-related illnesses among nearby residents may indicate changes to the physical health impacts of streets.
Additionally, as streets become more inviting to active use, health indicators such as obesity and cardiovascular disease can verify the benefits of more active urban environments.
Finally, mental health can be improved by urban green space; proximity and access to urban green spaces reduce stress and anxiety.6 Survey street users to understand how they perceive greened versus unimproved streets, documenting how they react to or perceive stressful events, with or without green spaces.
Equity
An equitable green infrastructure program distributes green space among neighborhoods with a conscious recognition of the need to avoid harm to vulnerable people, as low-income neighborhoods have historically borne a greater risk for exposure to pollution and toxins.7 Any negative impacts, such as flooding, must not be disproportionately borne by one community.8
Analyze the spatial distribution of GSI facilities and tree canopy and assess whether resources are being invested equitably. Use flooding models to supplement information from the public (such as 311 calls or constituent complaints) to inform and select project locations, and ensure that projects are being implemented across neighborhoods regardless of socio-economic factors.
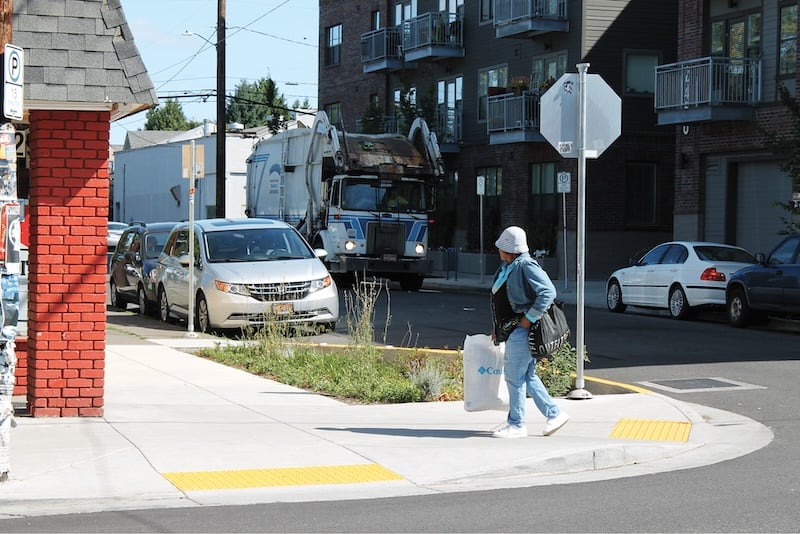
Portland, OR
Portland’s Bureau of Environmental Services completed a report in 2010 documenting the impacts of its Gray to Green program on residents using a wide variety of social and economic indicators. Researchers found broad improvements to resident satisfaction, economic value, and air and water quality around green project locations.9
- Netusil, Noelwah R., Zachary Levin, Vivek Shandas, and Ted Hart. “Valuing green infrastructure in Portland, Oregon.” Landscape and Urban Planning 124 (2014): 14-21. ↩︎
- Akbari, H. “Energy Saving Potentials and Air Quality Benefits of Urban Heat Island Mitigation.” Lawrence Berkeley National Laboratory (2005). Accessed Nov. 2016 (http://www.osti.gov/scitech/biblio/860475) ↩︎
- Institute for Sustainable Communities. Greencorps Chicago: Program to Reintegrate Ex-Offenders Into the Workforce (2010). ↩︎
- United States Environmental Protection Agency. “Heat Island Effect.” Accessed Nov. 2016. https://www.epa.gov/heat-islands. ↩︎
- City of Phoenix. Tree and Shade Master Plan. City of Phoenix, AZ; 2010. Accessed Dec. 2016 (https://www.phoenix.gov/parkssite/Documents/071957.pdf) ↩︎
- Alcock, Ian, Mathew P. White, Benedict W. Wheeler, Lora E. Fleming, and Michael H. Depledge. “Longitudinal effects on mental health of moving to greener and less green urban areas.” Environmental science & technology 48, no. 2 (2014): 1247-1255.
Tzoulas, Konstantinos, Kalevi Korpela, Stephen Venn, Vesa Yli-Pelkonen, Aleksandra Kaźmierczak, Jari Niemela, and Philip James. “Promoting ecosystem and human health in urban areas using Green Infrastructure: A literature review.” Landscape and urban planning 81, no. 3 (2007): 167-178. ↩︎ - Vanderwarker, A. “Water and Environmental Justice.” A Twenty-First Century US Water Policy (2012): 52. ↩︎
- Wolch, Jennifer R., Jason Byrne, and Joshua P. Newell. “Urban green space, public health, and environmental justice: The challenge of making cities ‘just green enough’.” Landscape and Urban Planning 125 (2014): 234-244. ↩︎
- City of Portland Bureau of Environmental Services. Portland’s Green Infrastructure: Quantifying the Health, Energy, and Community Livability Benefits. City of Porland, OR: 2010. Accessed Nov. 2016 (https://www.portlandoregon.gov/bes/article/298042) ↩︎