Project-Level Measures
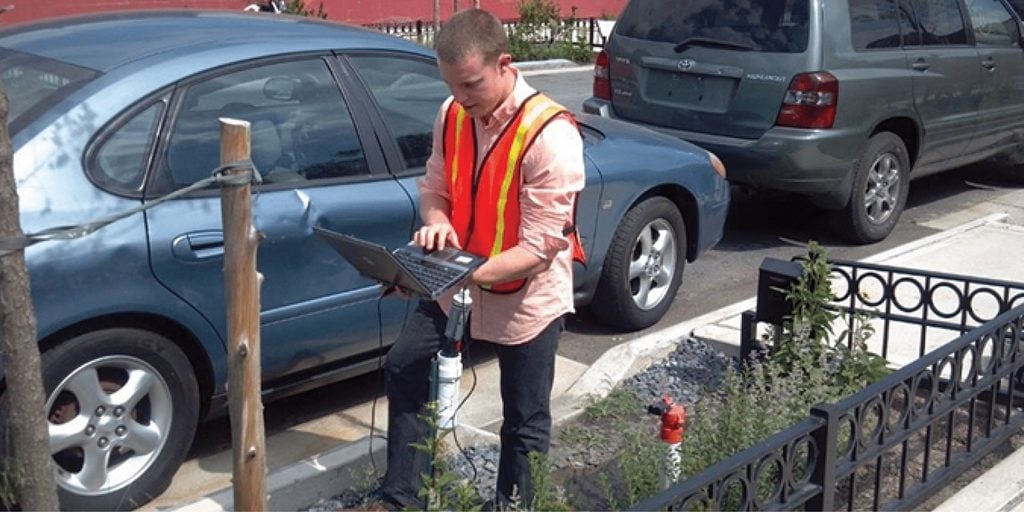
New York City Department of Environmental Protection
Volume Reduction
Reducing the volume of stormwater runoff that enters the gray infrastructure system and local water bodies is a primary goal of green infrastructure projects. Volume reduction can be achieved through a combination of retention, evapotranspiration, and infiltration, depending on design goals.
Calculate the retention basin storage volume required to attenuate peak stormwater flows. Use rain gauges to collect rainfall data that sets a baseline on which to measure evapotranspiration rates and runoff. Measure stormwater runoff in the drainage area before project construction, and then monitor either outfalls or bioretention cells after implementation to evaluate runoff volume reductions.
Water Quality
Whether water is being detained and slowly released into the sewer system, or infiltrated into the ground, removing pollutants and improving water quality is a central goal of GSI projects for environmental restoration, public health, and regulatory compliance.
Measure the pollutant level in runoff entering the sewer system or local water bodies adjacent to the project site, both before and after project implementation, to assess improvements to water quality.
Flood Control
Green stormwater infrastructure projects are often implemented to reduce flooding, both on streets and in neighborhoods with high water tables and significant basement flooding.
Measure volume reduction at project outfalls to evaluate the impact on flood control. Track reports of traffic closures due to street flooding, as well as 311 calls or insurance claims of basement floods in buildings adjacent to the project area.
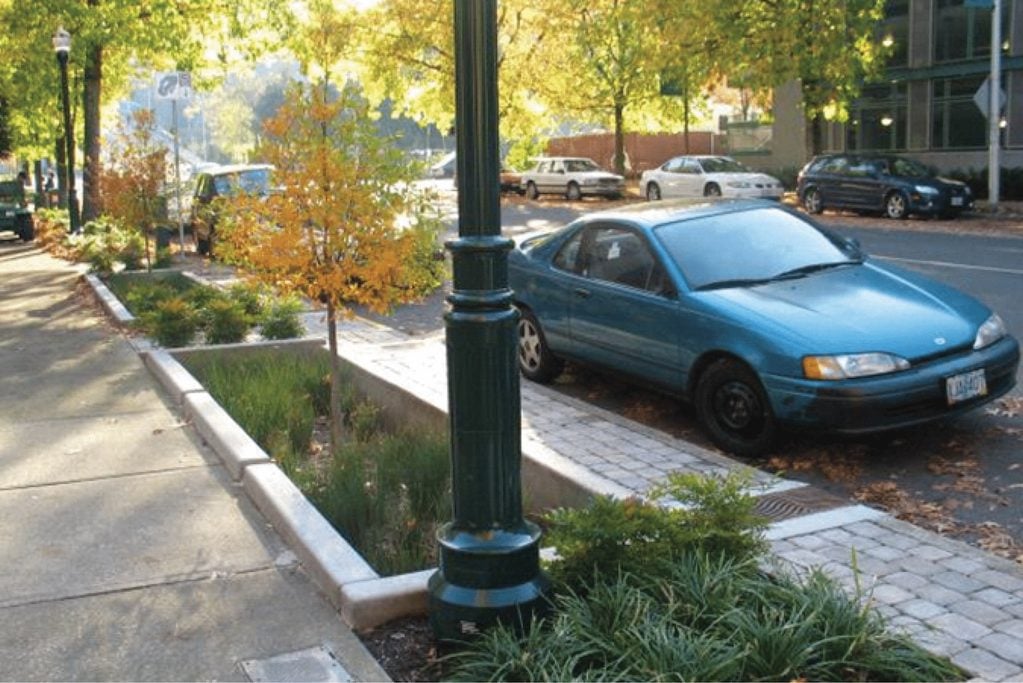
Portland, OR
On SW 12th Street & Montgomery Street, four on-line planters have successfully retained 72â77% of runoff volume during storm flow tests. Designers also tested drawdown time, soil pollutants, and ponding depths for all four cells between 2007 and 2010.
Channel Protection
GSI projects are often implemented to mitigate degradation of downstream rivers and creek beds. Urban stormwater runoff, especially frequent, high-volume flows, can cause riverbank erosion, which in turn can cause severe damage to bridge and sewer infrastructure or waterfront property. Channel degradation also negatively impacts wildlife habitat and biodiversity.
Direct measurements of the riverbanks and creek beds will give an indication of the project’s impact on downstream channel protection.
Drawdown Time
Bioretention facilities capture and store water before slowly releasing it into the sewer system or infiltrating it into the ground. Captured water must drain within the specified drawdown time, generally 24 to 72 hours, to limit the duration of ponding and ensure facilities can accommodate the next storm.
In some climates, drawdown time is especially important to prevent mosquito larva from developing in ponded water.
Infiltration Rates
Stormwater facilities, permeable pavements, and soil media are evaluated on their ability to infiltrate water. Infiltration rate, described in inches per hour, measures the rate at which water passes through the surface media, such as exposed soil or porous pavement.
Infiltration rates vary depending on project location, soil or pavement porosity, the soil’s ability to treat pollution and sediment, and the project’s distance from the water table. Other factors determining infiltration rates include seasonal changes to groundwater levels, shallow bedrock or other limiting soil layers, and historic industrial land use at the site with residual pollutant loads.
Infiltration rates should be designed to reduce pollutant loads passing through the soil media to the water table. Test the infiltration rate at the site before and after project installation to measure success. Continue to test for changes in infiltration rate over time.
Pollutant Loads
Rain that falls on the ground collects sediments, nutrients, and heavy metals as it flows across the street surface and into the stormwater management facility. Capturing and filtering these pollutants at the stormwater cell prevents downstream pollution or algae blooms that pose public health risks and degrade the environment.
Measure suspended solids in stormwater runoff as a proxy for measuring nutrient and heavy metal loading. Requirements for measuring water quality and pollutant loads are often determined by a consent order.
Plant Health
The ability of plants to survive and thrive is crucial to the green infrastructure’s stormwater management performance. Maintaining healthy plants is also key to community buy-in.
Plant health depends on soil mix, pollutant load, runoff flow intensity, salt spray, risk of trampling, and hardiness against flooding or drought. Species diversity is an important factor in providing more robust ecosystem services.
Evaluate whether plants are able to establish in the stormwater cell. Monitor plant health as a metric of project success.
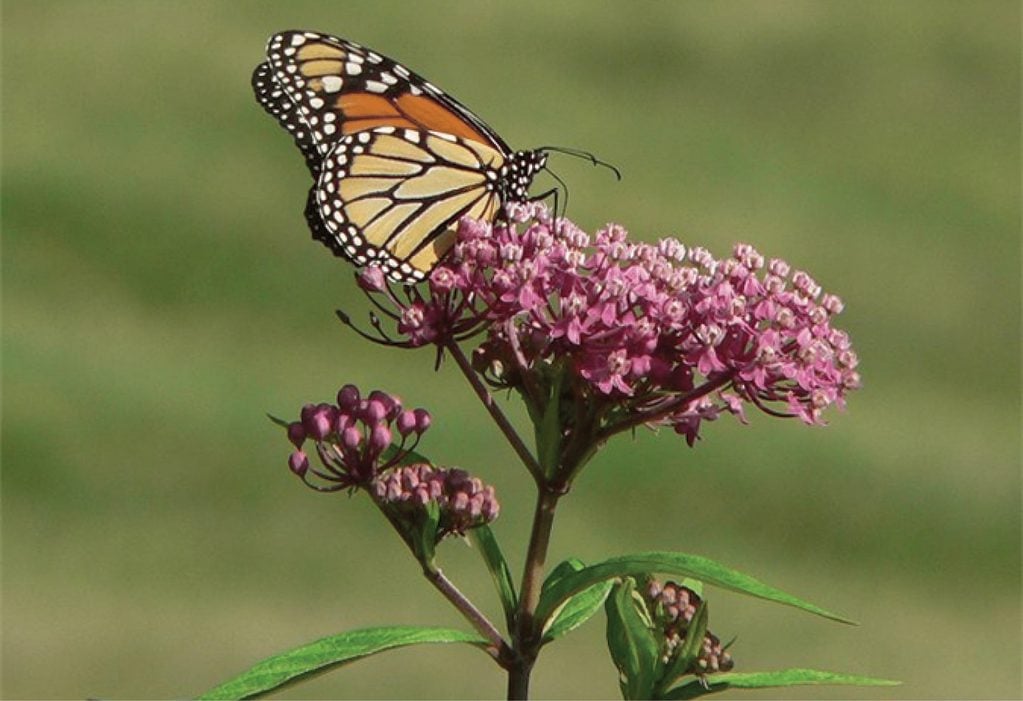
Austin, TX
Austin City Council passed a 2015 resolution to incorporate native milkweed into city-owned properties to increase and improve pollinator habitat. Since then, the Austin Watershed Protection Department has included milkweed plants in green stormwater infrastructure projects to attract bees, monarch butterflies, and other pollinators.1
Species Habitat
Native bee populations have declined in recent years due to habitat loss and pesticide use, posing a grave risk to the food crops that rely on pollination. In urban areas, human development threatens habitat for many pollinator species, including butterflies, moths, beetles, and hummingbirds.
Vegetated stormwater infrastructure with diverse, native plants can increase habitat for bees and other pollinators, restoring important ecological connections. Habitat restoration in urban areas is a foundational step to preserve healthy bee colonies, which support food crops for human consumption.
Monitor the presence of pollinators at green infrastructure projects.
Program-Level Measures
Green Acreage
Green stormwater infrastructure programs are implemented to reduce impervious surface cover at a citywide scale, reducing barriers to the natural hydrological cycle. Many cities have adopted Green Acreage goals, or the total land area where the first inch of rainfall that falls on impervious surface during each storm event is managed by green infrastructure.
Measure the reduction in percentage of impervious surface land area over the course of program implementation to evaluate and demonstrate progress toward this goal. Track and communicate progress about the increase in green acreage with the community to build broad citywide support.
Geographic Information System (GIS) tools can offer powerful and cost-effective methods to model and estimate vegetated cover on a large scale.
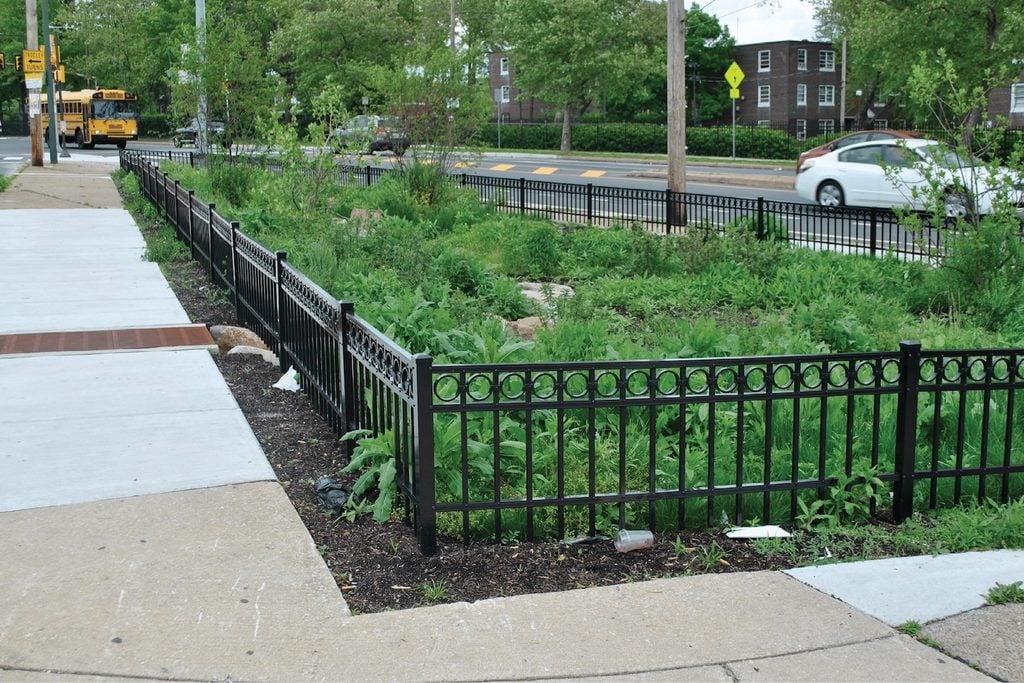
Philadelphia, PA
Philadelphia Water Department’s Green City, Clean Waters program tracks greened acreage toward meeting their consent order goals. The City added over 1,100 green stormwater management facilities between 2011 and 2016.2
Watershed Health
At a programmatic level, green stormwater infrastructure is designed to protect and improve watershed health. Watersheds transcend jurisdictional boundaries, and healthy watersheds are critical for public health, safe drinking water, and wildlife habitat.
Integrated assessments of watershed health include landscape condition, hydrology, geomorphology, habitat, water quality, biodiversity, and vulnerability to climate change. Learn more from the EPA’s Healthy Watersheds program.3
Tree Canopy
Many cities have specific goals to increase citywide tree canopy coverage. Calculate the increase in tree canopy coverage as part of a comprehensive GSI program.
Green infrastructure projects and increased tree canopy improve local air quality by removing pollutants and intercepting particulate matter. Measure local air quality progressively as greening programs are scaled.
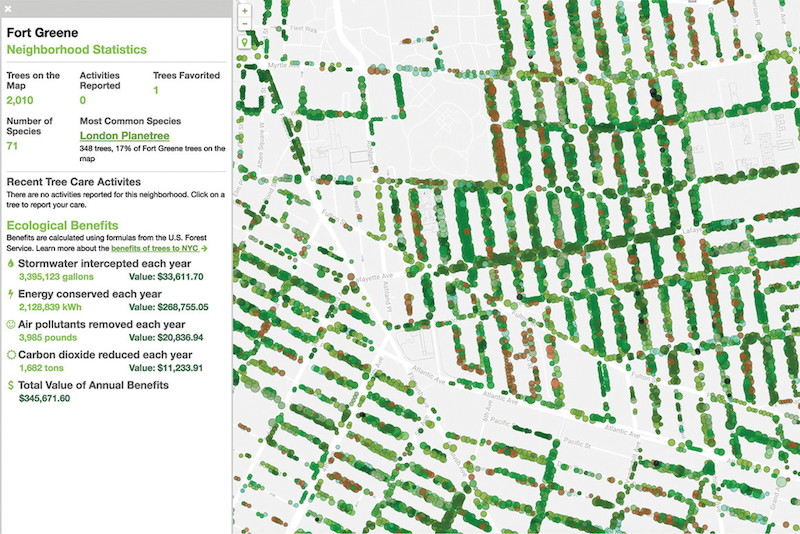
New York, NY
NYC Parks & Recreation maintains a citywide tree map with every street tree geolocated and measured. Tree-level data includes species, trunk diameter, and estimates for contributions to stormwater infiltration, evapotranspiration, and energy demand savings, both as a direct measure and with an estimate for economic value.4
Regulatory Compliance
In cities with a combined sewer system, heavy storms can overwhelm the water treatment plant capacity and excess runoff is discharged into nearby water bodies, often causing serious water pollution and posing public health risks. The Clean Water Act regulates the discharge of pollutants into water bodies. Many cities are under consent decrees with the EPA to reduce water pollution or combined sewer overflows, and many cities have local stormwater management water quality requirements in addition to federal regulations.
Green stormwater infrastructure is part of a citywide strategy to mitigate combined sewer overflow events and comply with federal water quality requirements. Measure the reduction in frequency and severity of combined sewer overflow events as a performance measure of GSI programs.
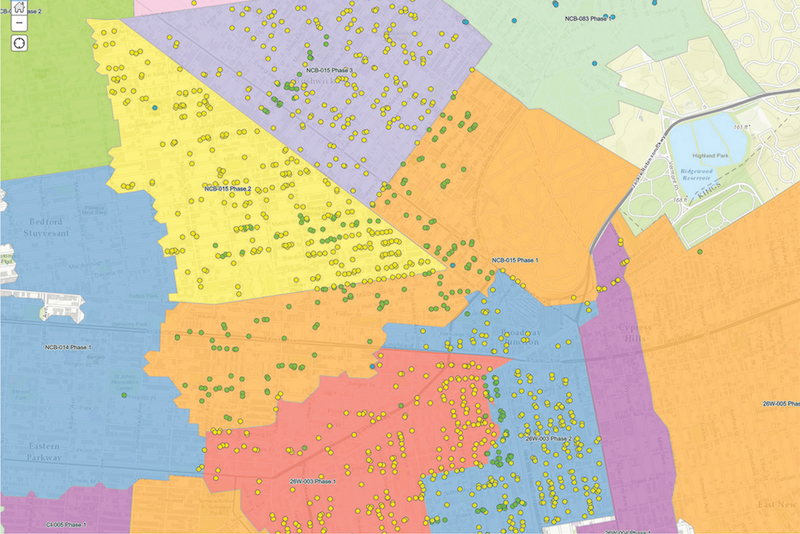
New York, NY
The Department of Environmental Protection tracks GSI assets and monitors progress toward its consent order goals using a public mapping tool, which displays construction progress and total implementation by combined sewer overflow tributary area.5
Flood Control
Many cities across the country have experienced record-setting rain events in the last ten years. Cities are experiencing 100- and 500-year storm events with more frequency, straining city storm sewer systems. These events have the ability to significantly impact the operation of streets and low-lying areas. Extreme rain events strain local wastewater collection systems, resulting in overflows and system back-ups.
Although GSI systems are typically not designed to mitigate extreme rain events, they can provide short term, interim storage capacity for lesser events that reduce the cumulative impact during extreme rain events. GSI projects can also reduce local flooding on streets and in neighborhoods with high water tables and significant basement flooding.
Measure volume reduction at project outfalls to evaluate the impact on flood control. Track reports of traffic closures due to street flooding, as well as 311 calls or insurance claims of basement floods in buildings adjacent to project areas.
Minneapolis, MN
Minneapolis Public Schools in partnership with the Holland Neighborhood Improvement Association and the Mississippi Watershed Management Organization collaborated to develop the state’s first green campus including permeable pavement, tree trenches along the right-of-way and stormwater storage tanks to mitigate extreme flooding in the neighborhood. The project is projected to capture and treat approximately 1.5 million gallons of runoff.6
Climate Change Mitigation
At a program level, green infrastructure provides shade and creates a cooling effect, reducing building energy consumption and the related greenhouse gas emissions.
Capturing more stormwater at the source reduces the electricity demand and the related greenhouse gas emissions at water treatment facilities.
When implemented at a citywide scale, green stormwater infrastructure is an important part of creating a livable city where people feel safe and comfortable walking. Shifting single-occupancy vehicle trips to walking and bicycling reduces greenhouse gas emissions.
Measure citywide greenhouse gas emissions over time and assess the role of green infrastructure in climate change mitigation.
- City of Austin. “What’s the Royal Buzz about Pollinators?” Accessed Dec. 2016. http://www.austintexas.gov/blog/what%E2%80%99s-royal-buzz-about-pollinators ↩︎
- Philadelphia Water Department. “Green City, Clean Waters.” Accessed Nov. 2016. http://www.phillywatersheds.org/what_were_doing/documents_and_data/cso_long_term_control_plan ↩︎
- United States Environmental Protection Agency. “Healthy Watersheds: Protecting Aquatic Systems through Landscape Approaches.” Accessed Nov. 2016. https://www.epa.gov/hwp ↩︎
- New York City Department of Parks and Recreation. “New York City Street Tree Map.” Accessed Nov. 2016. https://tree-map.nycgovparks.org/ ↩︎
- New York City Department of Environmental Protection. “DEP Green Infrastructure Program Map.” Accessed Dec. 2016. https://www.arcgis.com/home/webmap/viewer.html?webmap=0061d39df78d41978b9a662fb8d17981 ↩︎
- Mississippi Watershed Management Organization. “News Release: Edison High School Leads the State in Going Green.” August 16, 2016. Accessed Dec. 2016 (http://edison.mpls.k12.mn.us/uploads/edison-green-campus-news-release-2016-08-16.pdf) ↩︎