Making the case for transit streets involves choosing measurements that accurately reflect both the benefits and costs of a project, including those relevant to decision makers and to local stakeholders. This element of the street design process may differ greatly from metrics internal to either a transit operating agency or a streets department.
Beyond measures of movement, the safety, comfort, public space value, and spatial efficiency of a street are all important for understanding whether a transit street supports goals related to the people, neighborhood and city it is designed for.
Green Lane Project
Measure the Whole Street
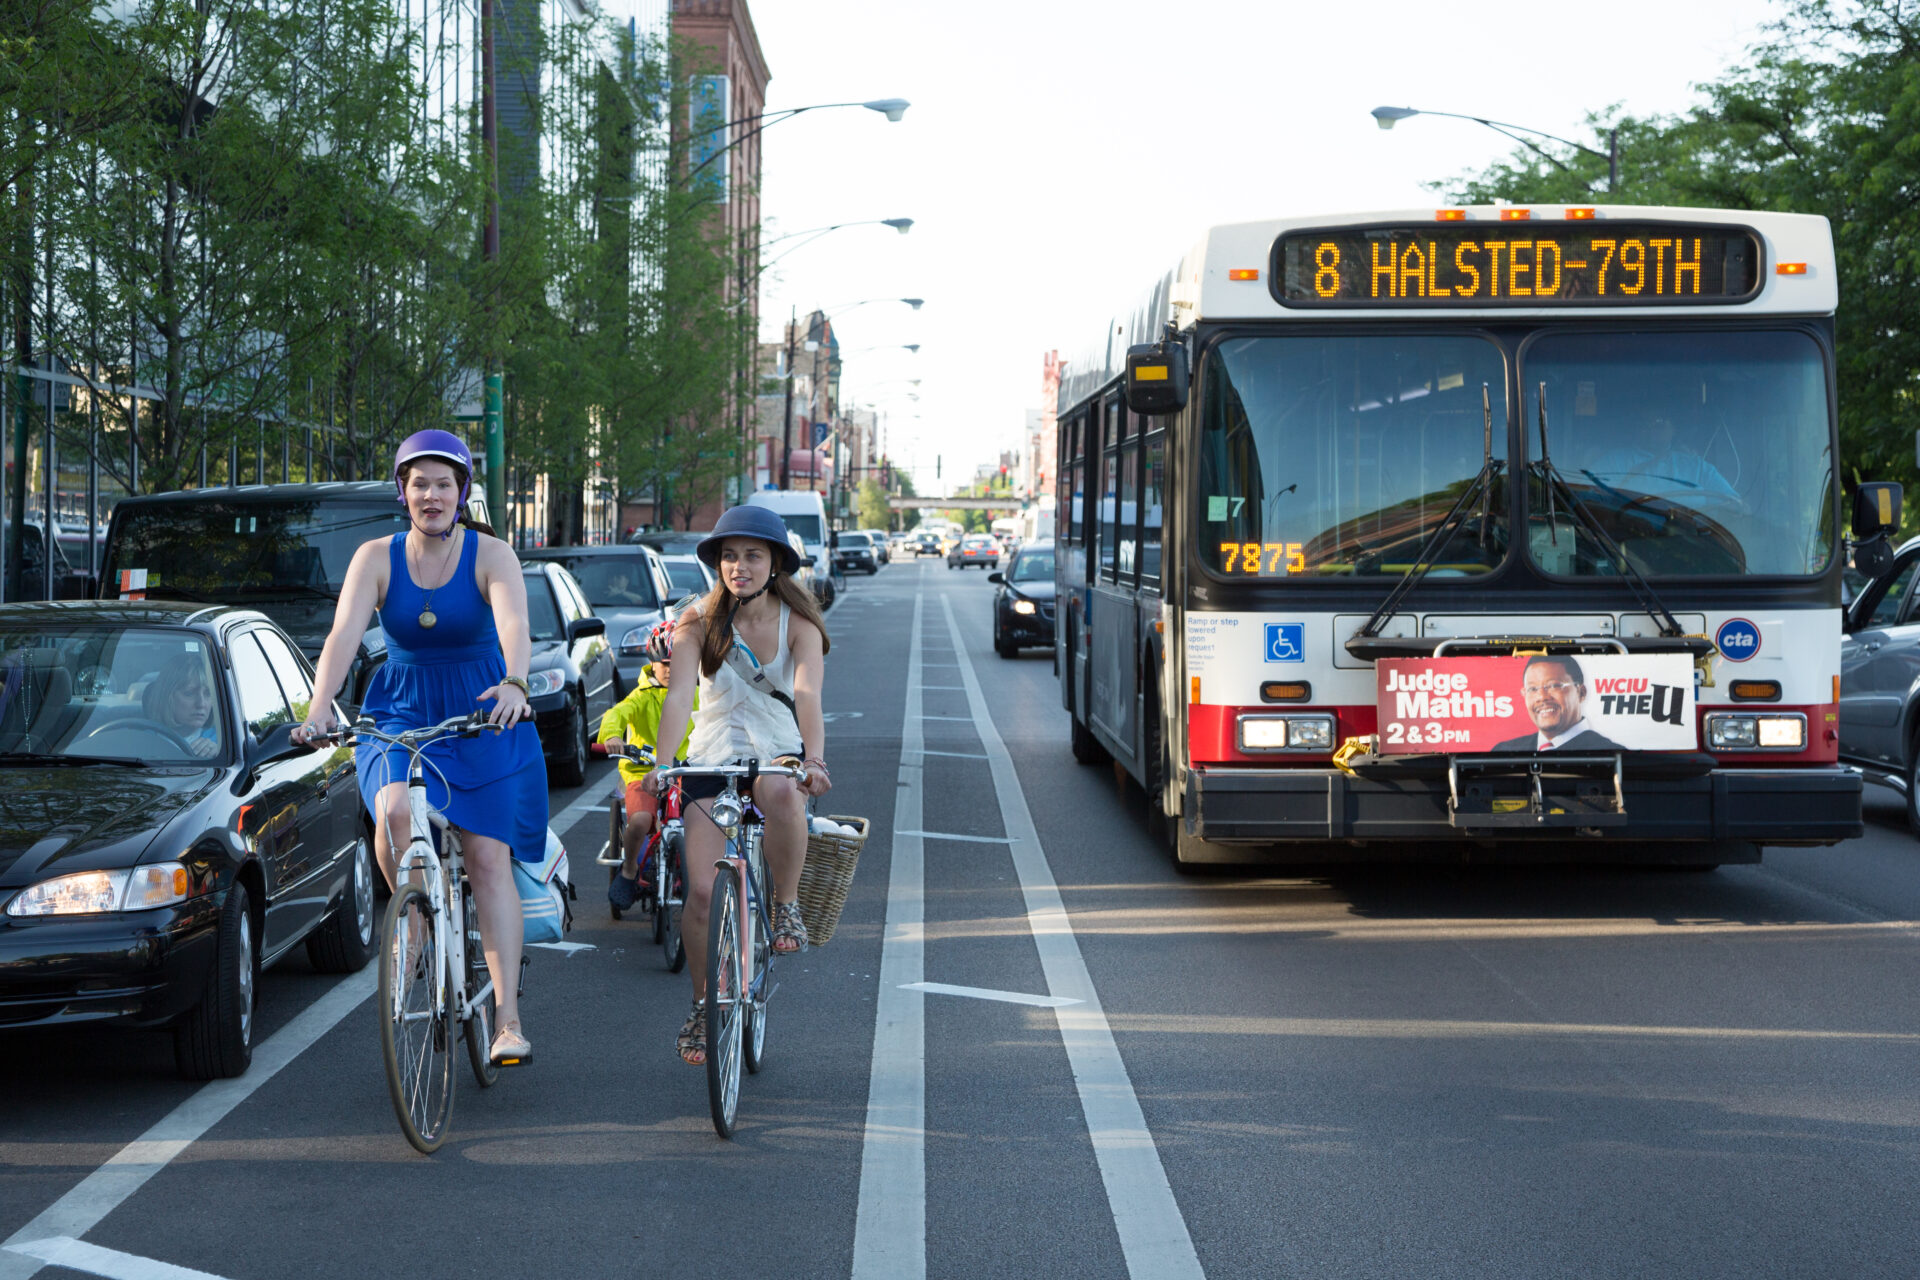
When the highest-capacity mode on a street can keep moving, transit riders aren’t the only beneficiaries.
Evaluating a transit street project involves comprehensively measuring how well the street works as a transportation corridor, but also how it works as a public place and as an investment. Transit operating agencies and street transportation departments have internal metrics used for understanding capacity and quality of service for each mode, with metrics being particularly well developed for transit service. This section discusses street measurements at the corridor and network level.
There are many additional goals that may be relevant to a project, including local and citywide environmental or mode shift goals. Cities should apply performance measures that relate to their specific policy goals, and provide feedback to project and program management based on these goals.
Mobility & Access
Measure how well a transit street moves people, goods, and services, considering capacity, volume, travel time, and reliability. Set multiple time periods for evaluation, such as full weekdays, weekends, and typical peak periods. Peak periods generally span several hours. Evaluating for peak 15-minute periods may lead to results prejudicial to all-day operation.
San Francisco Municipal Transportation Agency Photo Library
Counting People
Total person movement and total person capacity are primary performance measures for transit streets that encompass the current and long-term potential of a street to serve the city.
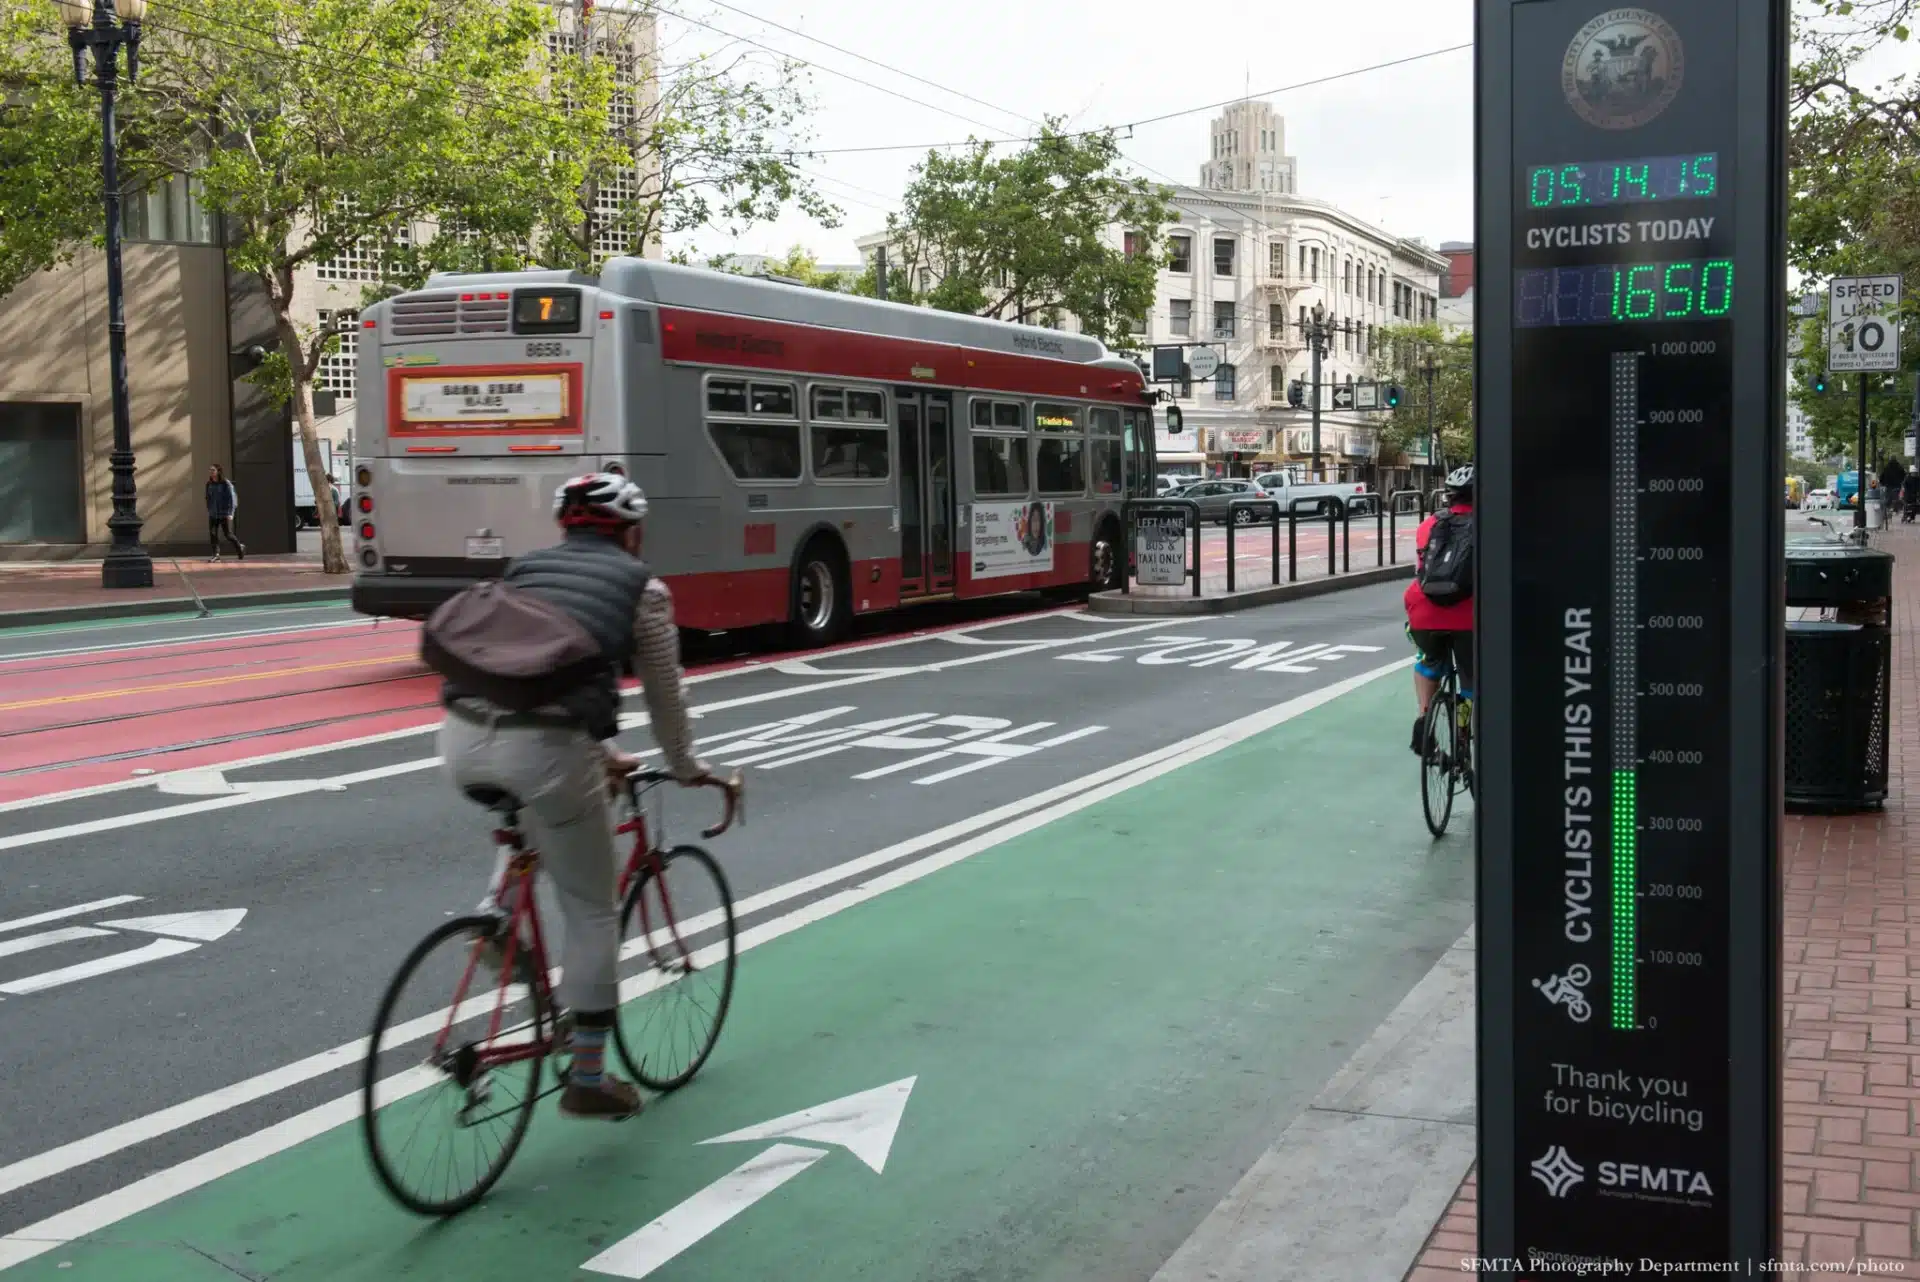
Count transit riders, people in private motor vehicles, people walking, and people riding bicycles. Use automated counts when available for walking, bicycling, and motor vehicle traffic, combined with short manual samples of vehicle occupancy to assess total person movement. Automatic passenger counters (APCs) precisely track ridership numbers and characteristics. Measuring ridership and boardings through specific segments and corridors enables highly localized analysis of transit performance.
Use average person capacity per lane to understand the effects of a design and the number of people moved per lane, at peak times and all day, as a performance measure for motorized modes. This measure is significantly more accurate than using vehicle capacity, vehicle delay, or vehicle traffic volume alone.
Transit Travel Time
Planned trip time combines average travel time and variation to generate a single number, such as the 50th or 85th percentile travel time, reflecting a typical traveler’s experience of the mobility system. Comparing these numbers across modes for a trip along the street, or for a set of trips around the network, helps evaluate the real time saved by transit street design changes. Pedestrian travel time which is affected by the completeness of the pedestrian network and by signal timing and the distance between crossings, should be added to provide a more accurate view of total travel time.
At the network level, the planned travel time can be used to evaluate the effects of a transit street project on the performance of the system as a whole. When applied to the entire city or region in relation to demographic and employment location data, planners can evaluate the number of jobs, businesses, or other neighborhoods accessible by transit within a target travel time. The equity of the transportation system can be evaluated using this method, by comparing the level of access provided to each neighborhood.
Across modes, delay compared with free-flow movement is important for understanding the potential value of various transit priority treatments, but is less meaningful when considering personal mobility. Use delay and queuing to inform intersection-specific design treatments, such as the size of pedestrian refuge areas or upstream traffic signal management. Changes to vehicle queue length at key intersections may be relevant to the perception of a project’s impacts, and should be understood in the context of overall street operations and impacts on cross streets.
Access to the City
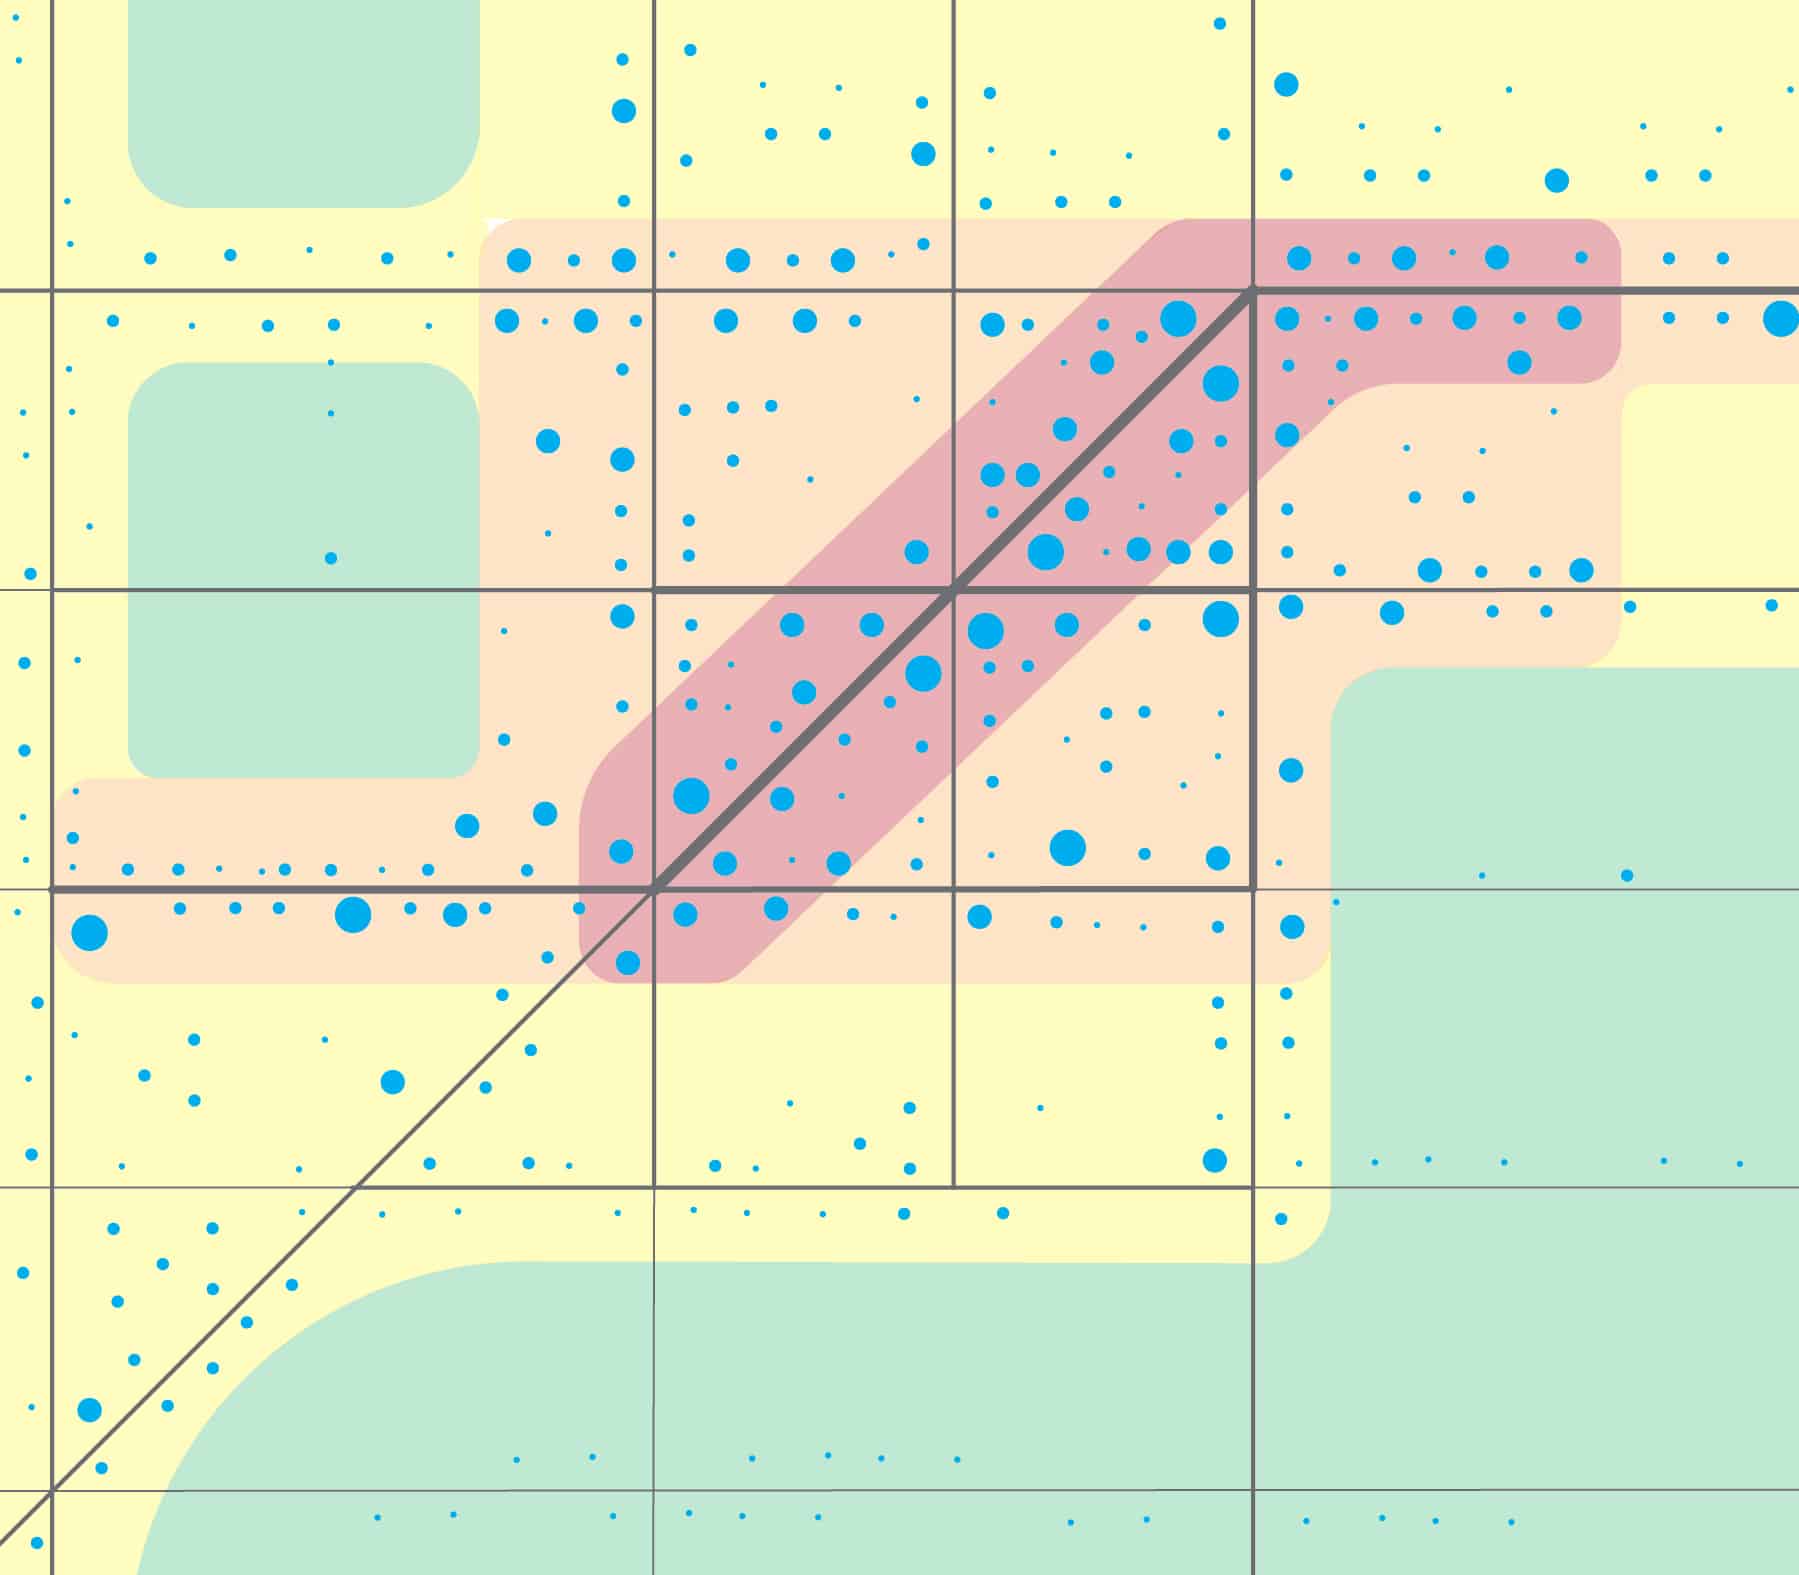
A primary metric for evaluating the effectiveness of a transportation system is the number of destinations—rather than the physical territory or distance—reachable by residents in set amounts of time. Applying this measure to the transit-walking system creates a master effectiveness metric that can be applied to evaluate potential large transit investments or changes in transit network structure.1
Private Motor Vehicles
In measuring results for general motor vehicle traffic, travel time and variation in travel time are often more relevant to drivers than common measures like vehicle delay and vehicular Level of Service. As for transit riders, change in the 85th percentile travel time is a useful measure for understanding results for typical users. Crowd-sourced and fleet-sourced traffic speed datasets can provide a network-level view of these changes over time. These include fleet GPS data, toll pass reader data, and data from companies that provide mobile map software or cellular phone service.
Motor vehicle traffic is often perceived to be negatively impacted by transit, but motor vehicle drivers may directly benefit from specific street design treatments, and receive indirect benefits from transit projects at the network level. Motor vehicle travel times may decrease if transit vehicle movements are simplified, or if designated transit lanes clear double-parking and vehicles queuing to turn from a former mixed traffic lane.2
Measuring vehicle traffic volume (throughput) before and after project implementation can provide information about mode shifts and spatial or temporal diversion, when network-level traffic data is available. As development occurs along a transit corridor, quantifying the total number of people using the street demonstrates the total value of the places along the street, and is a relevant measure for understanding the new destinations available to motorists in a given travel time.
Consider network-level evaluation for transit street elements that are expected to lengthen a street’s travel time for private vehicles, but may add significant transit capacity and eventually reduce vehicle trip demand. As mode shift occurs on the corridor, traffic volumes may decrease or remain constant.
At the city or region level, vehicle miles traveled and transit passenger miles traveled are key performance measures whose direction indicates whether a city is becoming more or less dependent on private vehicle travel. Commute mode split is an important and commonly used measure, and should be supplemented by measures of mode split for other trip types.
Curbside Management
Loading, parking, and curbside management are important regulatory facets of transit street project planning and evaluation. Transit street design treatments sometimes increase or decrease parking supply. Changes in on-street parking supply can be quantified by calculating the percentage change to the number of residential or commercial (metered) spaces available within a short walk of the transit corridor.
In cities, goods movement efficiencies are relevant for both travel time and loading. The number of illegally parked or double-parked trucks, or the time spent by a truck looking for a loading space, can be used to measure the effectiveness of curbside management for goods movement along a transit street.3
1 Safety
Comprehensive safety across modes can be measured along a street and compared with other streets. A comprehensive approach to injury prevention includes a focus on both fatal and life-altering injuries, and the potential for such injuries.
Multi-modal safety should be measured in terms of risk per distance of street (i.e. injuries per mile) or risk per user (i.e. injuries per million daily users). If total injuries are used as the numerator, separate motorized and active numbers should be calculated to avoid hiding the less frequent, but more severe, active-mode crashes. Alternatively, a measure of all-modes KSI (people killed or severely injured) per street mile or per million daily users provides a single measure of the risk that people bear when traveling on the street.
Since severe crashes are relatively rare events, it may be necessary to evaluate the safety of a street before statistically significant or reliable data is available on KSI crashes.
For faster analysis, changes in the top or 99th percentile vehicle speeds, or the percentage of vehicles operating above the target speed, may be used to understand the effectiveness of safety measures and changes in the risk of serious injury to transit occupants and pedestrians, soon after a project is implemented.
Conflict counts, which measure the number of evasive actions taken to avoid an imminent crash at a specific location, can be used in conjunction with other engineering assessment tools to understand the safety performance of a particular street redesign.
At the city or regional level, the number of transportation injuries, severe injuries, and deaths; and injury rates per capita are primary safety performance metrics. The safety performance of transit vehicles and systems can be measured in injuries or crashes per revenue mile or injuries per passenger mile traveled. However, since limiting or reducing the total miles of vehicle travel in a region is a major motivation for transit investments, evaluations of multi-modal safety should avoid denominating by distance traveled.4
Safety can be evaluated at an operational level more quickly than crash data analysis permits, allowing potentially life-saving changes. 95th percentile vehicle travel speed and the percent of vehicles exceeding the speed limit or exceeding the street’s target speed can be used to evaluate the effectiveness or consistency of traffic operational measures on the street. Measures of conflicts per day between motor vehicles and pedestrians or bicyclists can be used to quickly assess whether specific safety issues have been addressed by a design treatment.
2 Public Space & Social Life
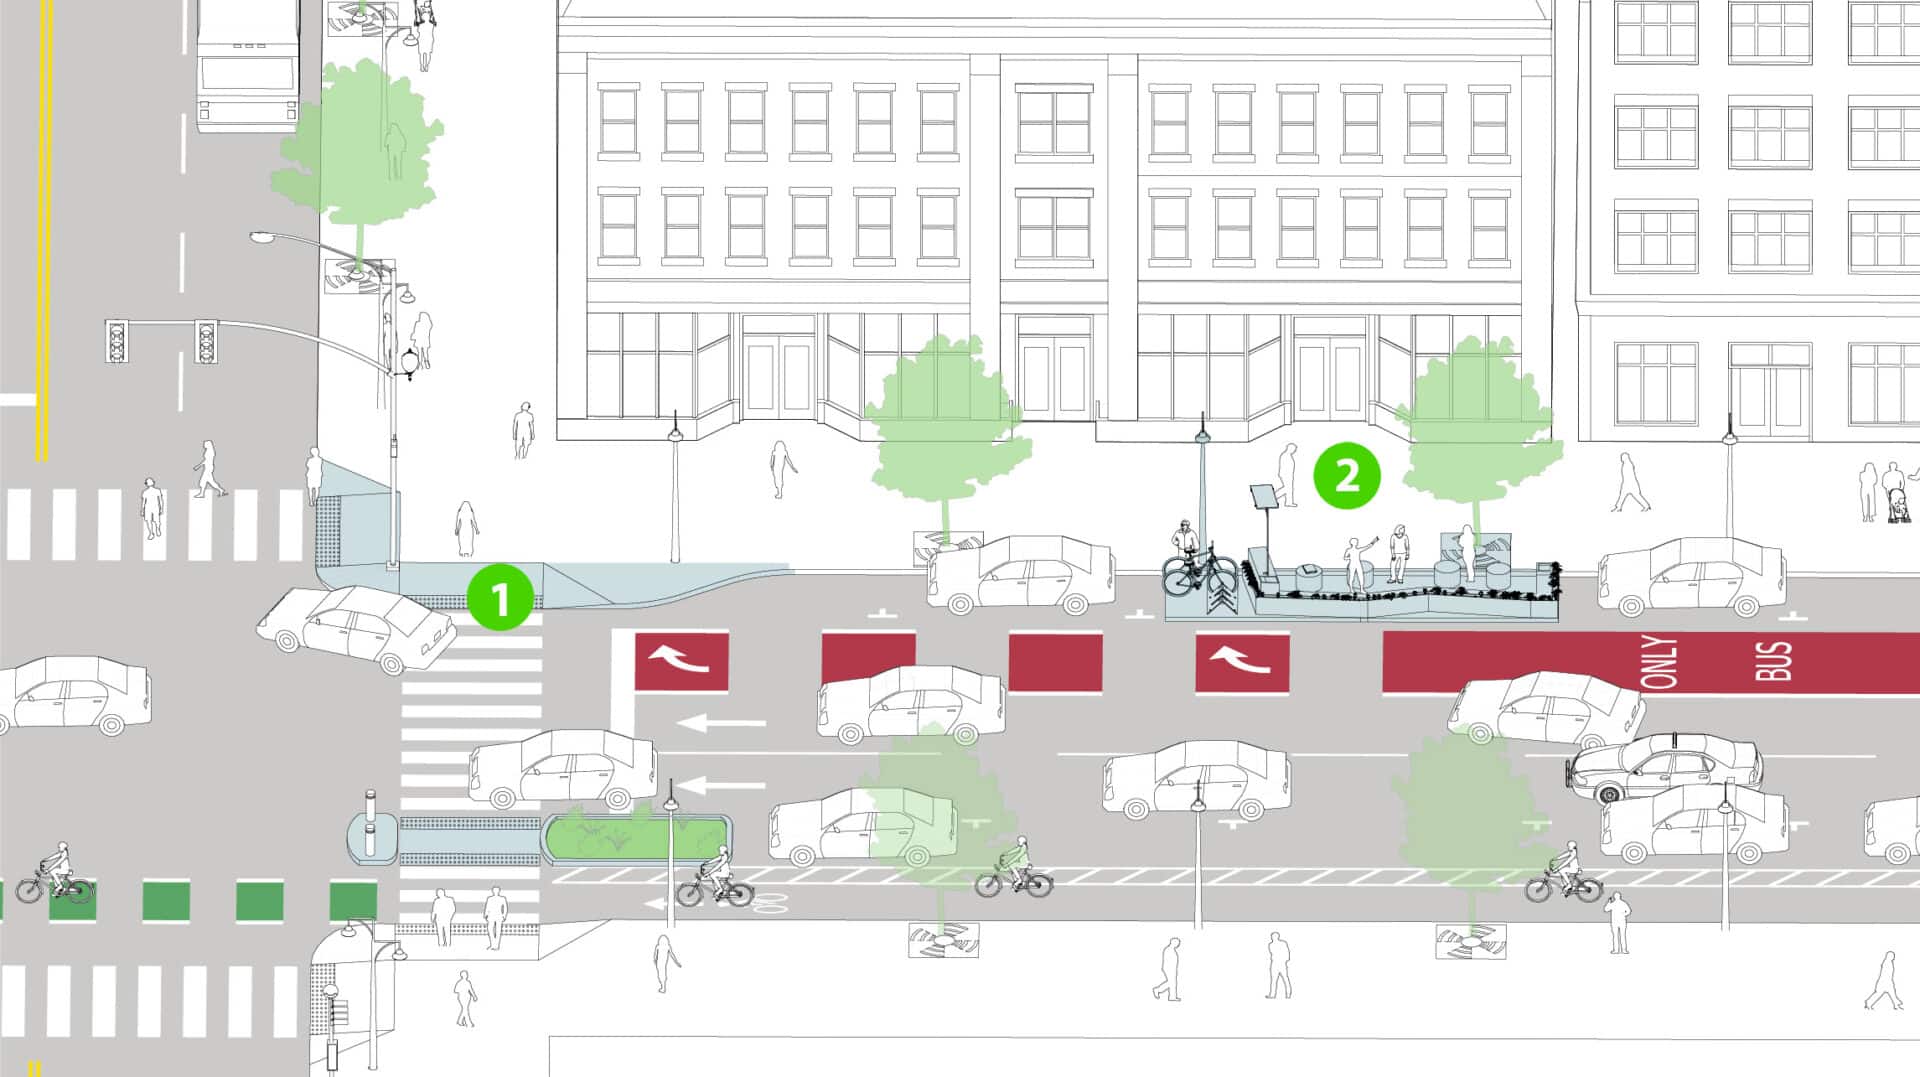
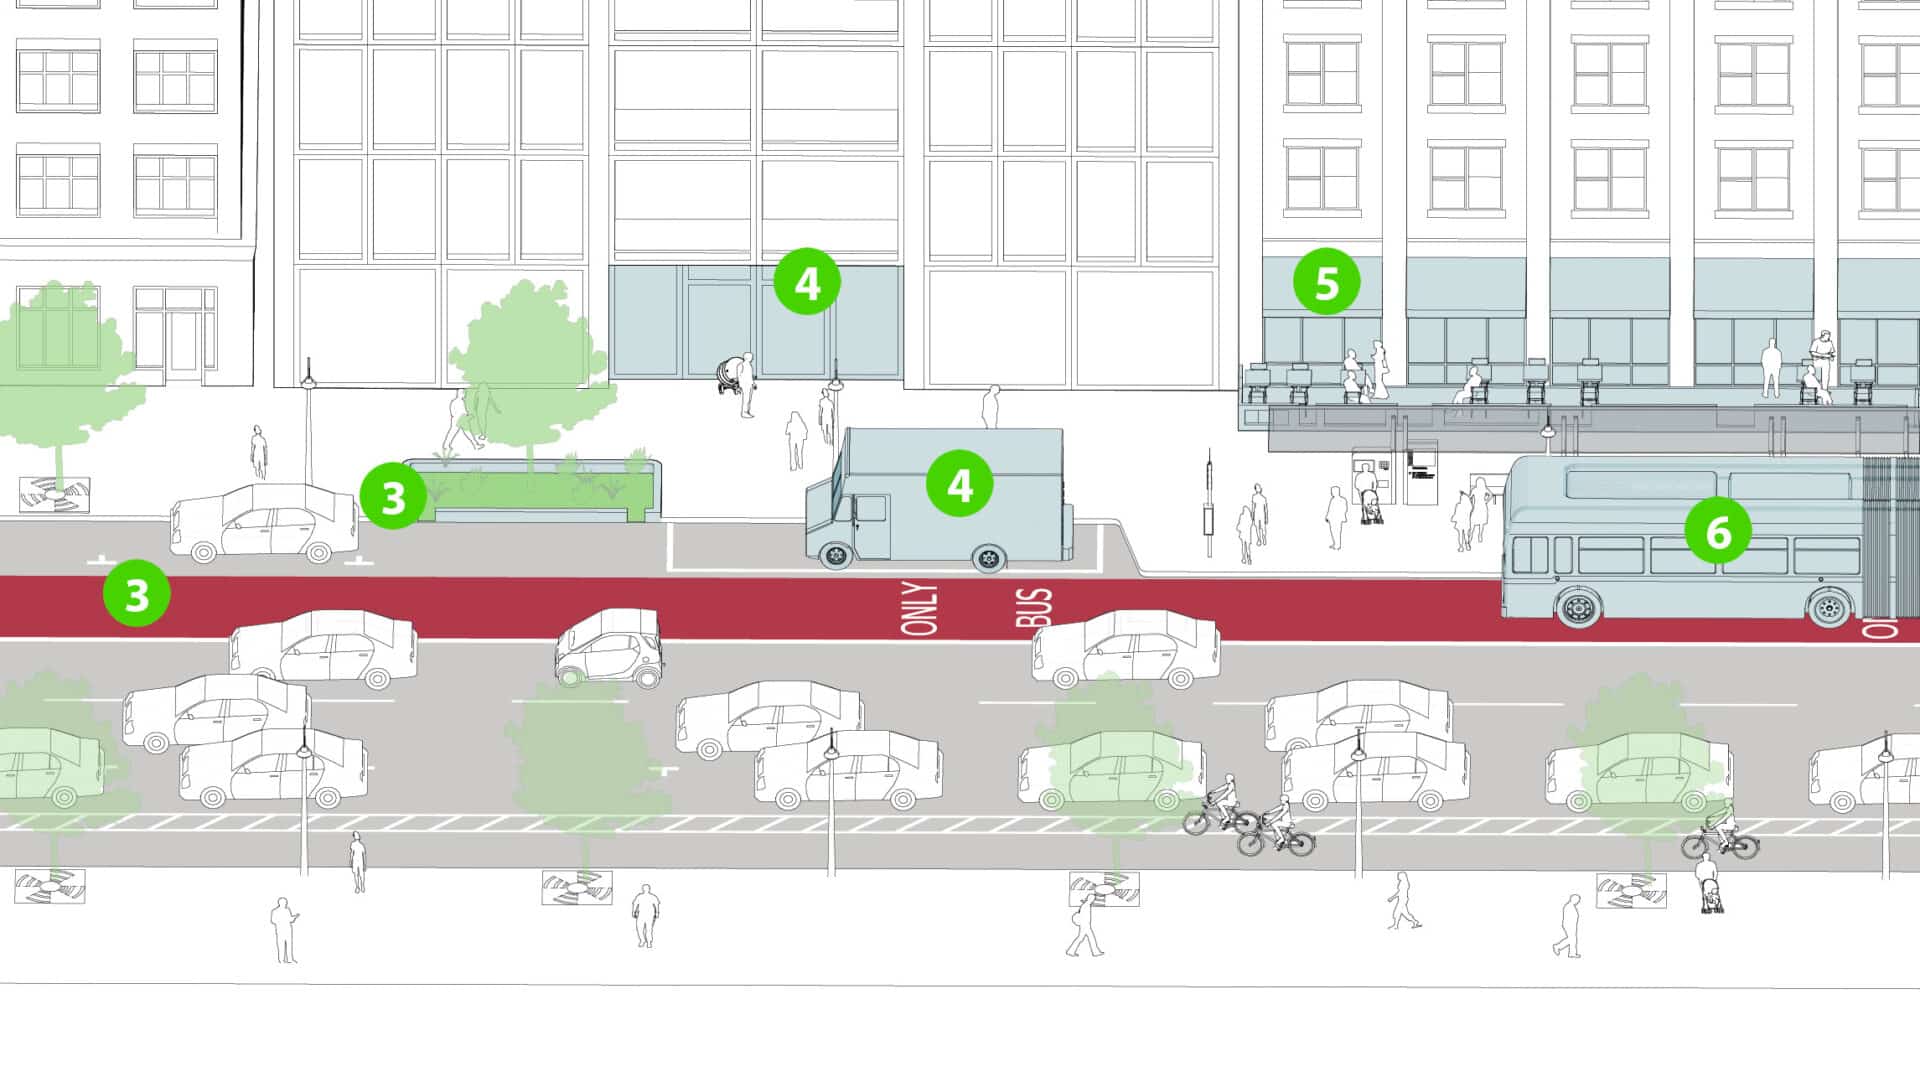
The amount of space available for stationary activities, including social, civic, and market activities, is an important component of a transit street’s potential benefits. Measure the acreage or width of sidewalk space and other public space made available as a result of a transit project.
The quality of public space is a leading indicator for both transit and business potential. Public space canvassing, which counts the number of people engaged in stationary activity in a place, is a measure of public space quality and availability. For projects with a public space component, this measure provides hard data to support quality-of- life conclusions. Supplement these observational counts with survey data on public space quality and project satisfaction for a more comprehensive understanding of the experiential quality of a public space.
Sidewalk comfort and safety can be quantified using measures relevant to human comfort, including the availability of shade, adequate street lighting, and active ground floor uses. Develop measures specific to the project, climate, and social life of the street.
3 Health, Sustainability, & Environment
When transit performs at a high level, it competes with automobile travel rather than with walking. Changes in vehicle mode travel have very important impacts on public health and environmental sustainability that relate to the policy landscape of transit. Many cities have adopted sustainability goals that include greenhouse gas emissions reductions, and many have regulatory obligations related to local air quality.
Physical activity related to added or improved transit can be measured in daily time spent being active or distance walked or biked. Increases in physical activity may be correlated with changes to the built environment that increase transit ridership, such as increased density or walkability.
Increasing transit mode share on a street can dramatically improve the street’s air quality, with benefits for public health and sustainability. Air quality can be measured and compared across modes as emissions per occupant mile, with greenhouse emissions and particulate emissions singled out as areas of special concern.5
Surface permeability ratio, pavement reflectivity, and surface air temperature are affected by the amount of paved area, and the type and color of material used.
Economic Productivity
Transit street productivity can be measured in terms of business, residential, and institutional benefits. Capital investment is an important measure for large transit-oriented development projects, but may miss the value added to existing buildings when transit access improves.
4 Business Sales
Local business sales can be measured using sales tax receipts and related data. This is a good short- or medium term measure that is more accurate and faster than using real estate sales, and may be more readily available than commercial lease data. In New York City, a study performed using this measure found that corridors and major intersections with bus improvements experienced retail sales growth of 50% to 71%, against a baseline of 18–22% for their borough (county) as a whole.6 Storefront occupancy is another medium-term measure for retail streets, with easy data collection and methodology.6
5 Development and Redevelopment
Development density and new local development, in square footage or dollar investment, are long-term measures of economic and land use benefits of transit projects, especially for projects involving rezoning or redevelopment. The Healthline BRT in Cleveland, Metroway BRT in Alexandria and Arlington, VA, Phoenix light rail, Portland streetcar, and Charlotte LYNX light rail are all examples of projects with large local development results associated with a transit project and other coordinated investments.7
6 Cost Savings from Transit Productivity
Transit service quality and efficiency are related, with time savings directly related to cost savings. Faster travel time means maintaining the same frequency of service with fewer transit vehicles in circulation on the route, freeing resources for other routes. Increased frequency and shorter wait times, or operating cost savings, can be quantified by transit providers to inform the public discussion, especially related to infrastructure investments.
City governments also benefit from transit street investments, most directly from additional property, sales, or other taxes per acre. Evaluating these returns on public investment in comparison with a business-as-usual development scenario shows specific value to the public.