Speed plays a critical role in crashes and the severity of their outcomes. Traditional street design was grounded in highway design principles that forgive driver error and accommodate higher speeds. This approach based the design speed and posted speed limit on 85th-percentile speeds—how fast drivers are actually driving rather than how fast drivers ought to drive. By designing for a faster set of drivers, crashes increase and drivers actually traveling the speed limit are put at risk. This passive use of design speed accommodates, and indirectly encourages, speeding by designing streets that account for the worst set of drivers and highest potential risks. Higher design speeds, moreover, degrade city streets and walkable neighborhoods by mandating larger curb radii, wider travel lanes, guardrails, streets with no on-street parking, and generous clear zones.
Lowering injuries and fatalities remains a crucial goal for our cities. In 2011, 4,432 pedestrians were killed and 69,000 injured in motor vehicle crashes, according to the National Highway Traffic Safety Administration (NHTSA). Of the fatalities, 73% occurred in urban areas. This equates to 146 people killed or injured in cities everyday. To counteract these gruesome and unnecessary injuries and fatalities, cities should utilize speed control mechanisms that influence behavior, lower speeds, and in turn, reduce injuries and fatalities. Embracing a proactive design approach on new and existing streets with the goal of reducing speeds “may be the single most consequential intervention in reducing pedestrian injury and fatality.”1
In the mid-20th century, many 2-way downtown streets were converted to 1-way operation to streamline traffic operations, reduce conflicts, and create direct access points to newly built urban freeways. Today, many of these streets operate significantly below capacity and create swaths of empty pavement in downtown areas. While many cities are converting these streets back to 2-way operation, these broad roadways can be narrowed using cycle tracks and transit lanes, which require less cost and analysis, and optimize usage of the street as a public space.
Discussion
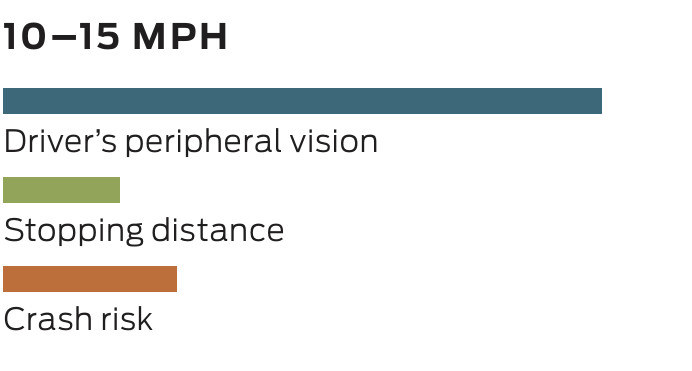
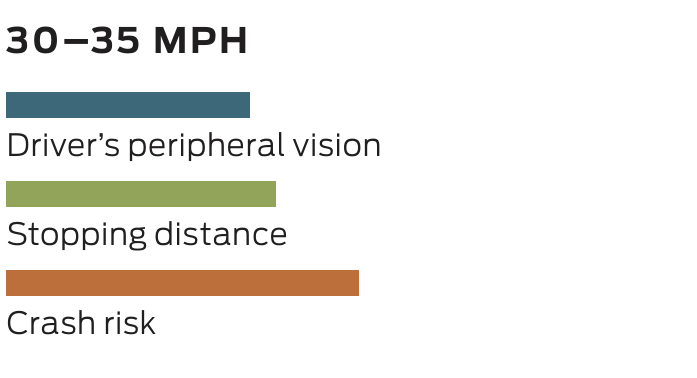
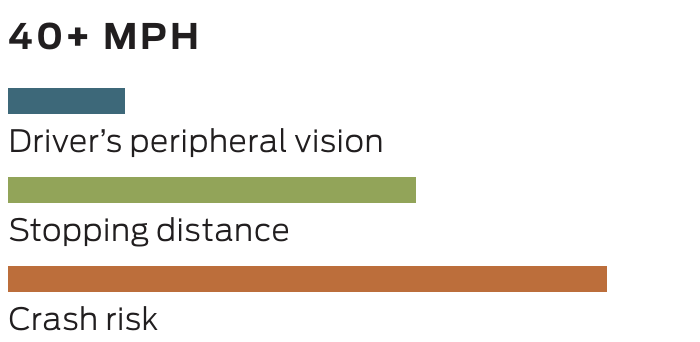
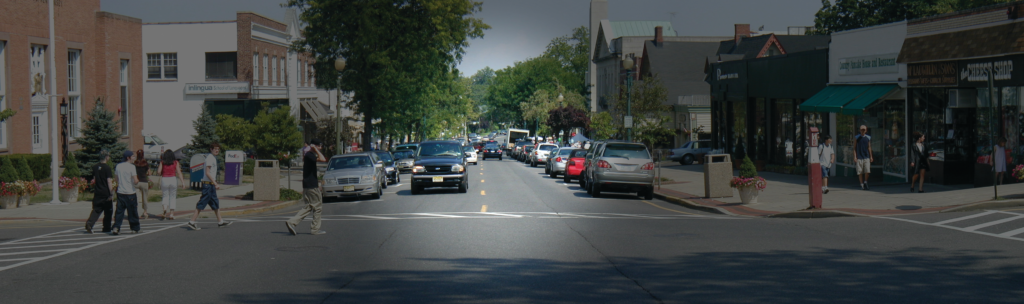
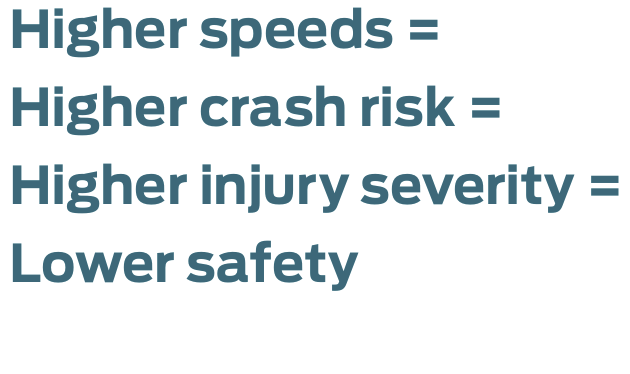
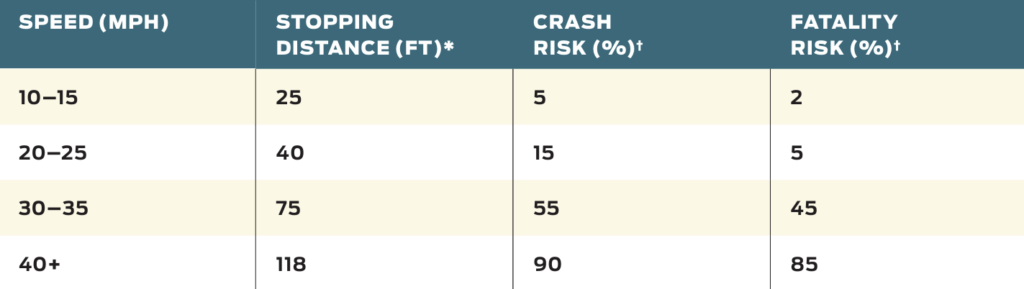
Speed plays a critical role in the cause and severity of crashes. There is a direct correlation between higher speeds, crash risk, and the severity of injuries.2
On city streets, designers should select a design speed to use in geometric decisions based on safe operating speeds in a complex environment.
Higher design speeds often mandate larger curb radii, wider travel lane widths, on-street parking restrictions, guardrails, and clear zones. Lower design speeds reduce observed speeding behavior, providing a safer place for people to walk, park, and drive.
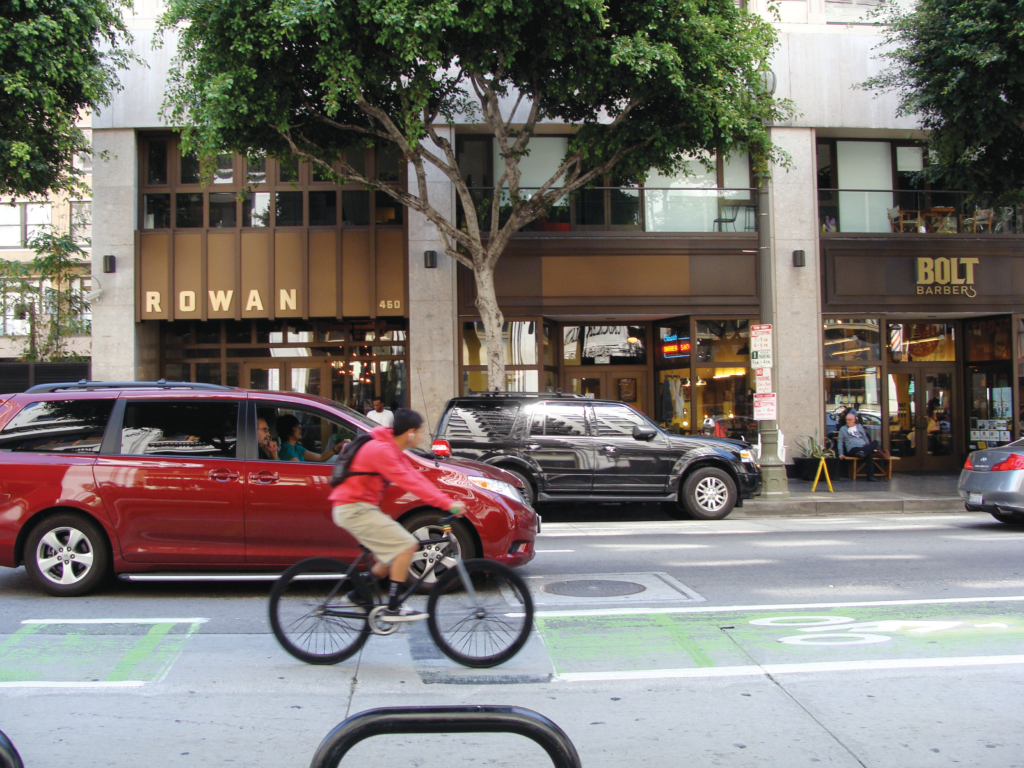
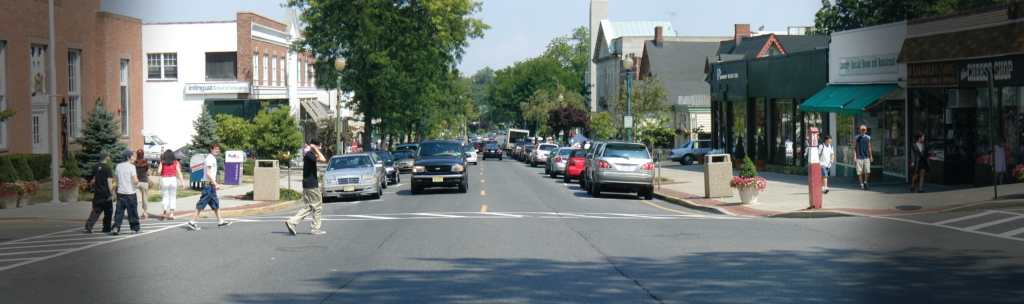
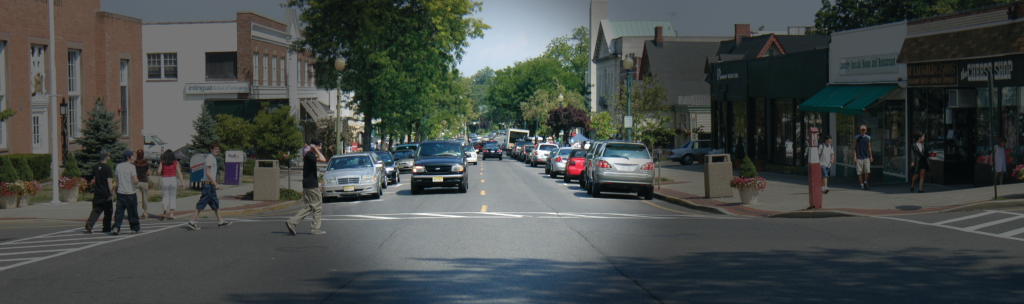
As a driver’s speed increases, his peripheral vision narrows severely.3


CONVENTIONAL HIGHWAY DESIGN:
Operating Speed = Design Speed = Posted Speed
PROACTIVE URBAN STREET DESIGN:
Target Speed = Design Speed = Posted Speed
Critical
Design streets using target speed, the speed you intend for drivers to go, rather than operating speed. The 85th percentile of observed target speeds should fall between 10–30 mph on most urban streets.
The maximum target speed for urban arterial streets is 35 mph.4 Some urban arterials may fall outside of built-up areas where people are likely or permitted to walk or bicycle. In these highway-like conditions, a higher target speed may be appropriate.
The maximum target speed for urban collector or local streets is 30 mph.
Use design criteria that are at or below the target speed of a given street. The use of higher speeds should be reserved for limited access freeways and highways and is inappropriate on urban streets, including urban arterials.
Bring the design speed in line with the target speed by implementing measures to reduce and stabilize operating speeds as appropriate. Narrower lane widths, roadside landscaping, speed humps, and curb extensions reduce traffic speeds and improve the quality of the bicycle and pedestrian realm.5
Mass Differential
Mass differential between street users results in more severe injuries to the lighter of the two colliding bodies.

Bus
24,000 lbs
Car
2,000 lbs
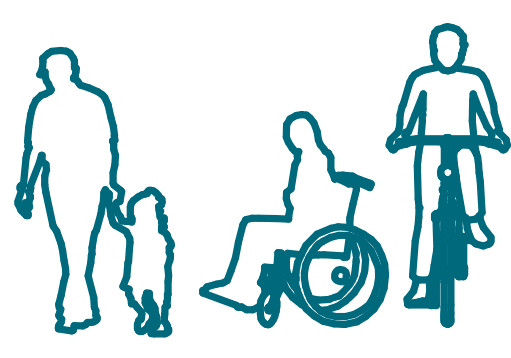
Cyclist/Pedestrian
30-250 lbs
Recommended
Use short cycle lengths and/or slow signal progressions in downtown areas and networks with closely spaced signals.
In neighborhoods, designers should consider 20 mph zones to reduce speeds to those safe for interaction with children at play and other unpredictable behavior.
On local roads or in areas with above-average pedestrian volumes, designers may choose to select a design speed below the posted speed limit. Certain states disallow posted speeds of less than 25 mph, but do not restrict operating speeds 10 mph below the speed limit.
Optional
Shared streets and alleys may be assigned target speeds as low as 5–10 mph.
Speed enforcement cameras have proven highly effective at reducing speeds and increasing compliance with the speed limit.
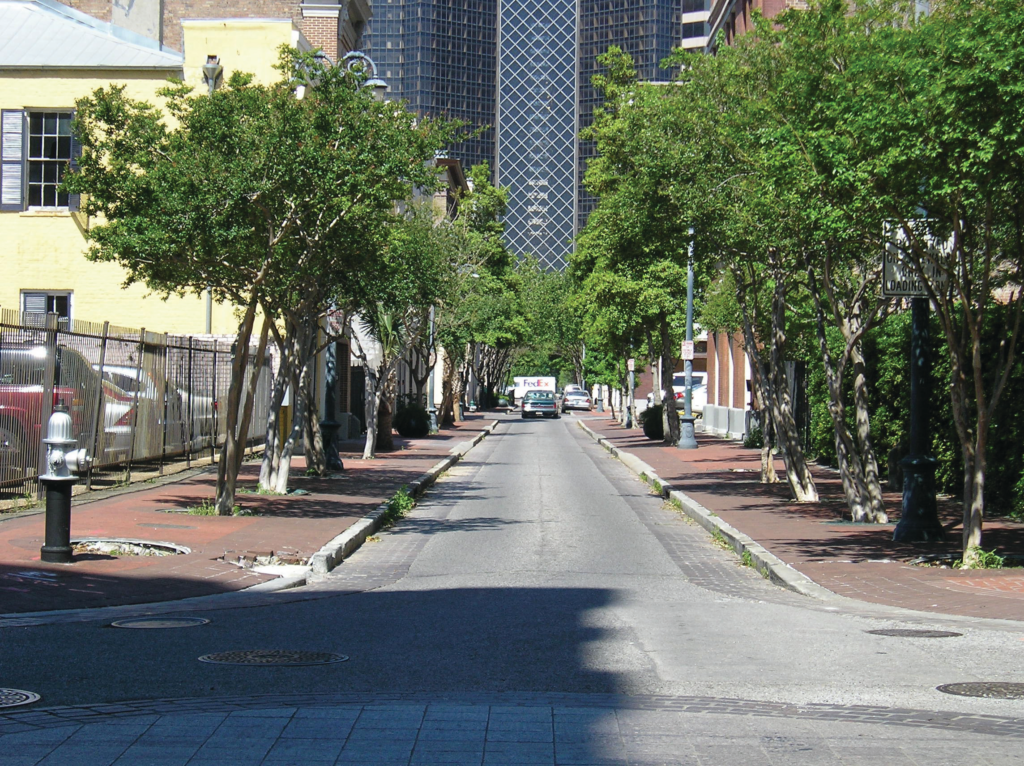
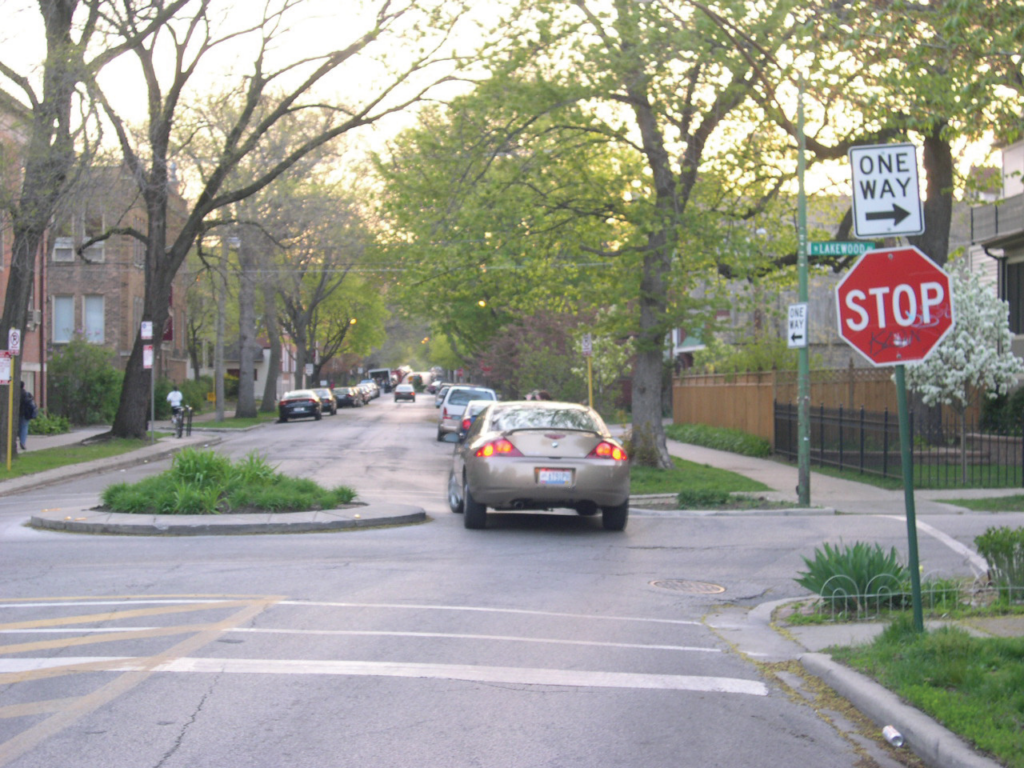
Narrow streets lower traffic speeds.
A mini roundabout slows speeds through a residential area.
In this Section
- “Pedestrian Safety Review: Risk Factors and Countermeasures,” (Salt Lake City: Department of City & Metropolitan Planning, University of Utah; School of Public Health and Community Development, Maseno University: 2012). ↩︎
- Rosén E., and U. Sander. “Pedestrian fatality risk as a function of car impact.” (Accident; Analysis, and Prevention 41, 2009), 536–542. ↩︎
- A. Bartmann, W. Spijkers and M. Hess, “Street Environment, Driving Speed and Field of Vision” Vision in Vehicles III (1991).
W. A. Leaf and David F. Preusser. Literature review on vehicle travel speeds and pedestrian injuries. (Washington, D.C.: U.S. Dept. of Transportation, National Highway Traffic Safety Administration, 1999).
Reaction plus braking distance is based on numerous factors, including the conditions of the roadway, slope, and other unique elements.
Ireland Road Safety Authority, “Stopping distances for cars,” accessed June 3, 2013, www.rulesoftheroad.ie/rules-for-driving/speed-limits/speed-limits_stopping-distances-cars.html.
University of Pennsylvania School of Engineering, “Vehicle Stopping Distance and Time,” accessed June 3, 2013, www.seas.upenn.edu/~ese302/lab-content/STOPPING_DISTANCE_DOC.pdf.
Driving Test Success, “Stopping Distances,” accessed June 3, 2013, www.drivingtestsuccess.com/tests/stopping-distances. ↩︎ - Designing Walkable Urban Thoroughfares: A Context Sensitive Approach (Washington, D.C.: Institute of Transportation Engineers, 2010), Chapter 7. ↩︎
- Relationship Between Lane Width and Speed: Review of Relevant Literature (Parsons Transportation Group, 2003). ↩︎