Transit Tools and Treatments
Stop improvements and bus-only lanes are critical interventions for improving transit performance. High rates of implementation show that both city DOTs and transit agencies recognize this.
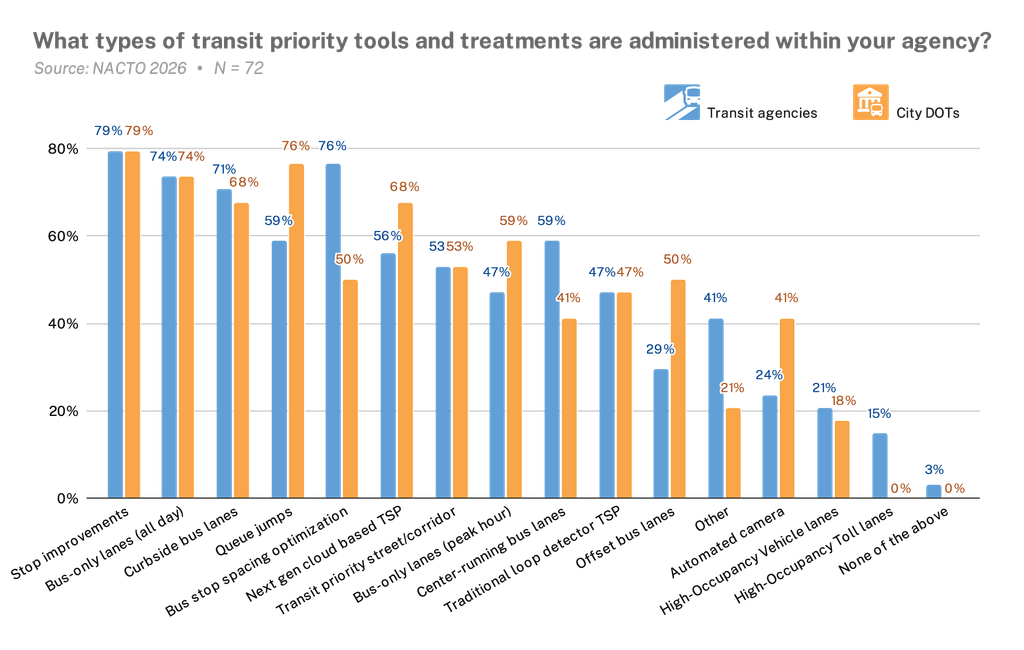
Stop improvements and bus-only lanes are critical interventions for streamlining passenger boarding and limiting the amount of time buses spend in traffic. High rates of implementation show that both city DOTs and transit agencies recognize this.
Nearly 80% of respondents are implementing stop-level improvements, such as in-lane bus stops, and 86% of respondents have implemented at least one type of bus-only or priority lane—including curbside, center-running, and offset lanes—or transit priority corridor to speed up travel times. Transit agencies are using their authority as operators to balance bus stop locations; by extending the average distance between bus stops, trip times can be greatly improved.
Beyond on-street infrastructure, many agencies are also leveraging signal treatments to move buses more efficiently through intersections: 83% of respondents have implemented some form of transit signal priority. City transportation departments, typically the owners of roadways and signal infrastructure, lead on implementing queue jumps and next-generation, cloud-based transit signal priority treatments.
Project Delivery
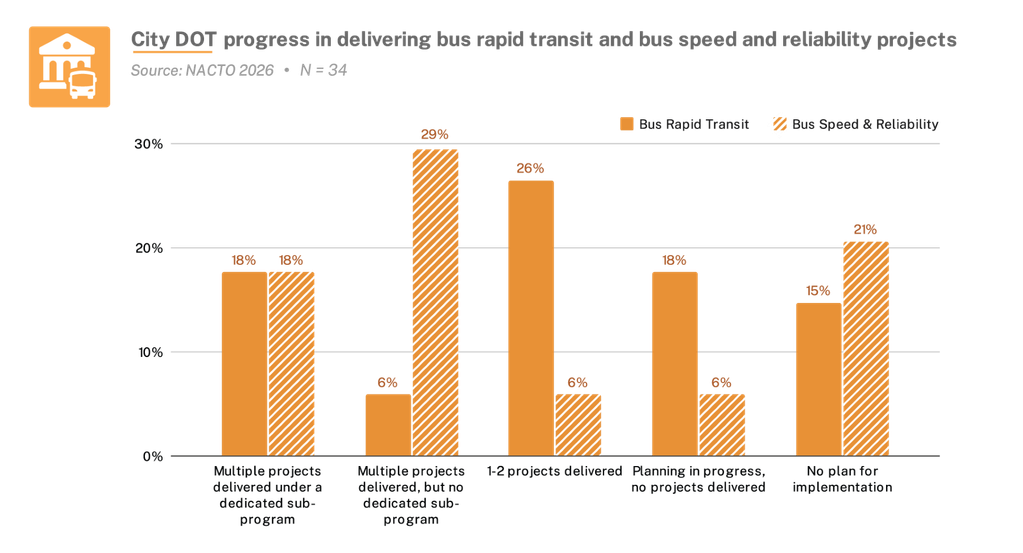
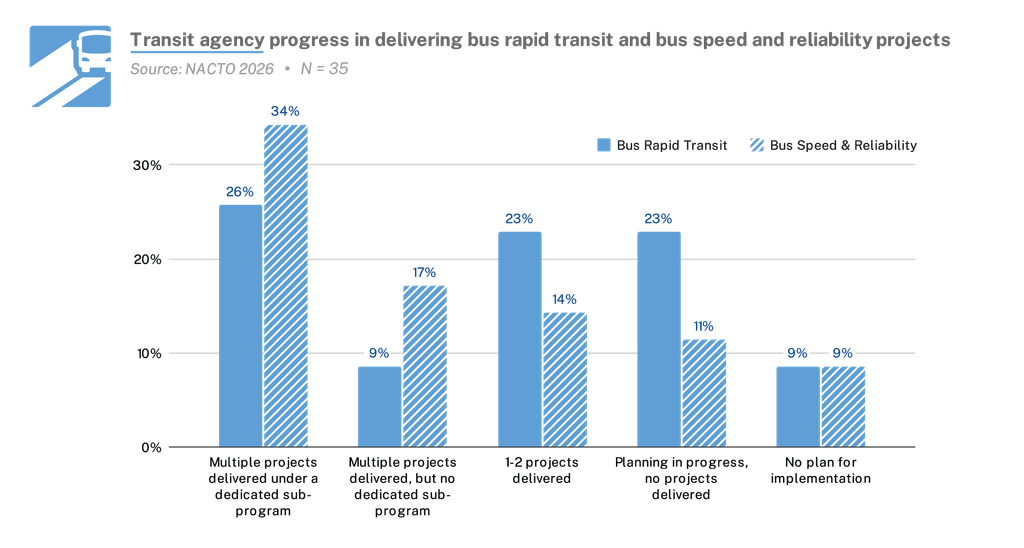
Most respondents have delivered at least one bus speed and reliability or bus rapid transit (BRT) project. Bus speed and reliability projects are typically a set of targeted improvements—such as signal timing, bus-only lanes, and stop spacing—that can be applied across many routes in a system. BRT is a more comprehensive investment on a specific corridor that combines dedicated lanes with features such as enhanced stations, frequent service, and off-board fare collection to deliver high-capacity service competitive with light rail.
Fifty-three percent of city DOTs have delivered at least one bus speed and reliability project, and half (50%) have delivered at least one BRT project. For city DOTs, most bus speed and reliability projects have been delivered without a dedicated sub-program. Cities were also more likely than transit agencies not to have plans to implement either BRT or bus speed and reliability projects.
Sixty-six percent of transit agencies have delivered at least one project to improve bus speed and reliability, and nearly 60% of them have delivered at least one BRT corridor project. Around a third of transit agencies have delivered multiple BRT or bus speed and reliability projects under dedicated sub-programs.
Measuring Outcomes
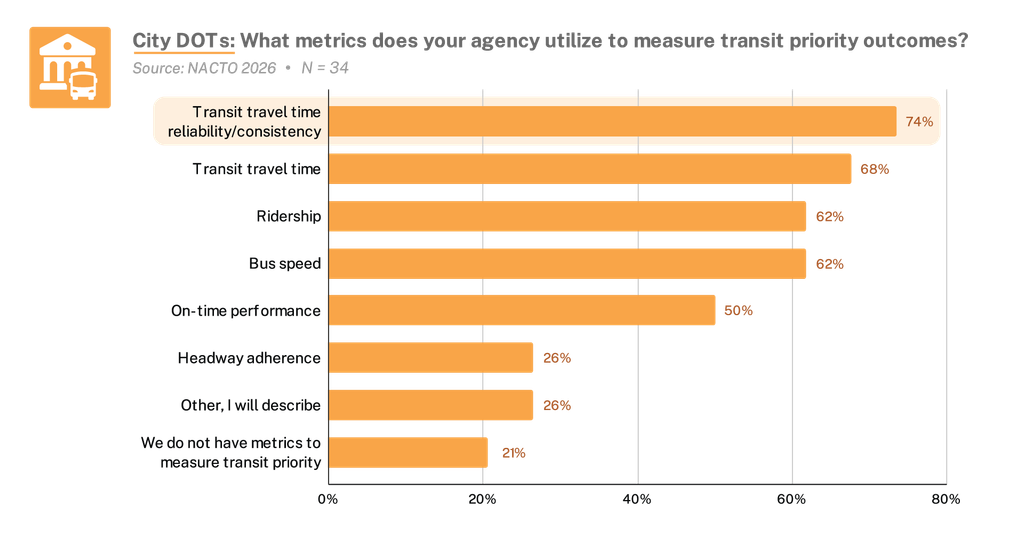
City DOTs selected transit travel time reliability as their top metric for measuring transit priority outcomes (74% of responses), followed by transit travel time (68% of responses), and ridership (63% of responses). Four of the ten “Other” responses noted that they do not have their own metrics to measure transit priority outcomes, and instead rely on their partner transit agency to provide them.
When asked what methods are used to monitor and report on transit priority outcomes, city agencies most frequently mentioned project and performance reports, data dashboards, and before-and-after evaluations.
A fifth of city DOTs reported they either do not have any internal or external reporting metrics or that those metrics are in development.
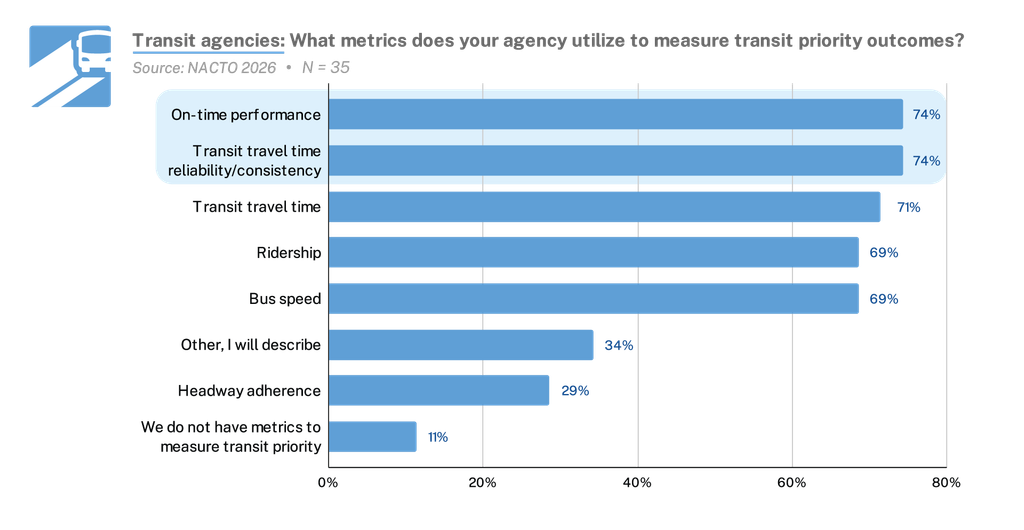
On-time performance and transit travel time are equally important metrics for transit agencies, with nearly three-quarters of transit agencies using them as measures of success. A majority of transit agencies also use transit travel time, ridership, and bus speed data to measure outcomes. In the “Other” category, transit agencies named additional metrics such as wait time, travel time savings, customer experience, safety improvements, corridor performance, and transit level of service.
When asked what methods are used to internally monitor and report on transit priority outcomes, transit agencies most frequently mentioned data dashboards, project and performance reports, automatic vehicle location data, automatic passenger counter data, and before-and-after evaluations.
Transit agencies most commonly use data dashboards, public-facing reports, and public communication to report outcomes to external audiences.