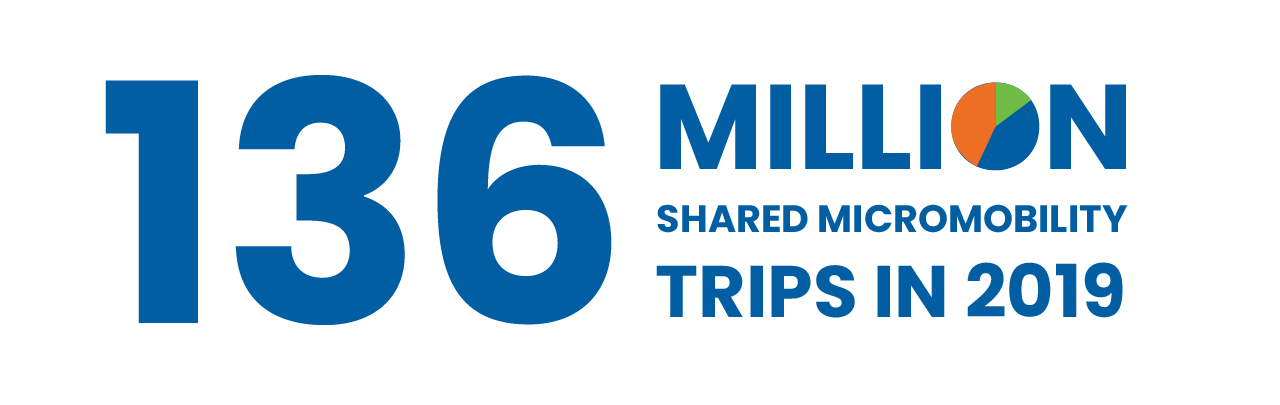
In 2019, people took 136 million trips on shared bikes and scooters, a 60% increase from 2018.
Foreword
For the past four years, NACTO has compiled annual statistics on the growth and use of shared micromobility (bike share, e-bike share, and scooter share) in the US. These numbers help create a robust picture of this nascent, vibrant, and rapidly-changing mobility option and industry, providing cities, advocates, and companies alike with a comprehensive look at trends, challenges, and opportunities.
This year, the release of the 2019 Shared Micromobility Snapshot coincides with the world-changing COVID-19 global pandemic. Some of the trends we saw hold steady in shared micromobility from 2010 to 2019 are changing in the first half of 2020.This 2019 Snapshot, focusing on the world as we knew it, offers lessons for where shared micromobility has been and where we might want to focus as we explore new, essential mobility options during the COVID-19 pandemic and in the post-COVID-19 world yet to come.
What we saw in 2019 and what 2020 has brought so far: read more on our blog >>
Big Increases in Shared Micromobility Use in 2019
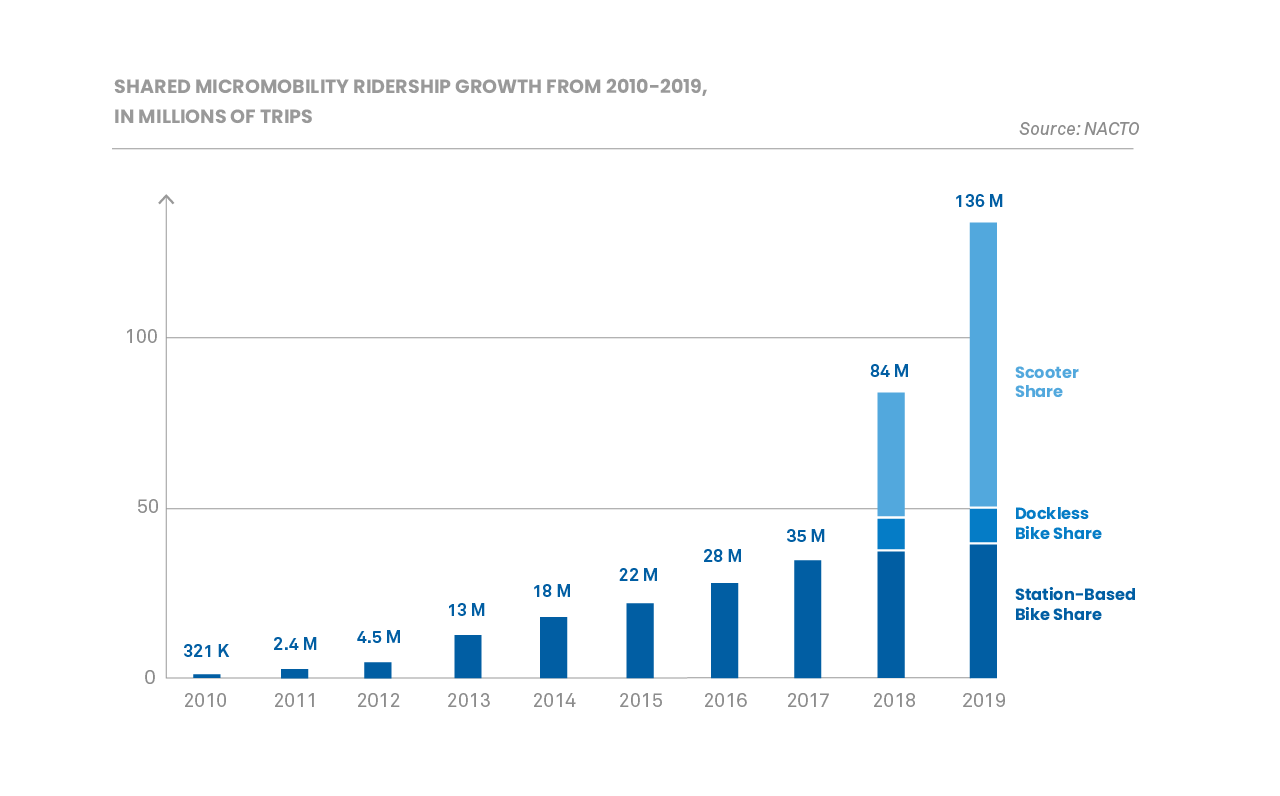
In 2019, people in the United States took 136 million trips on shared bikes, e-bikes, and scooters, 60% more than 2018. In total, since 2010, people in the U.S. have taken 342 million trips on shared bikes and scooters.
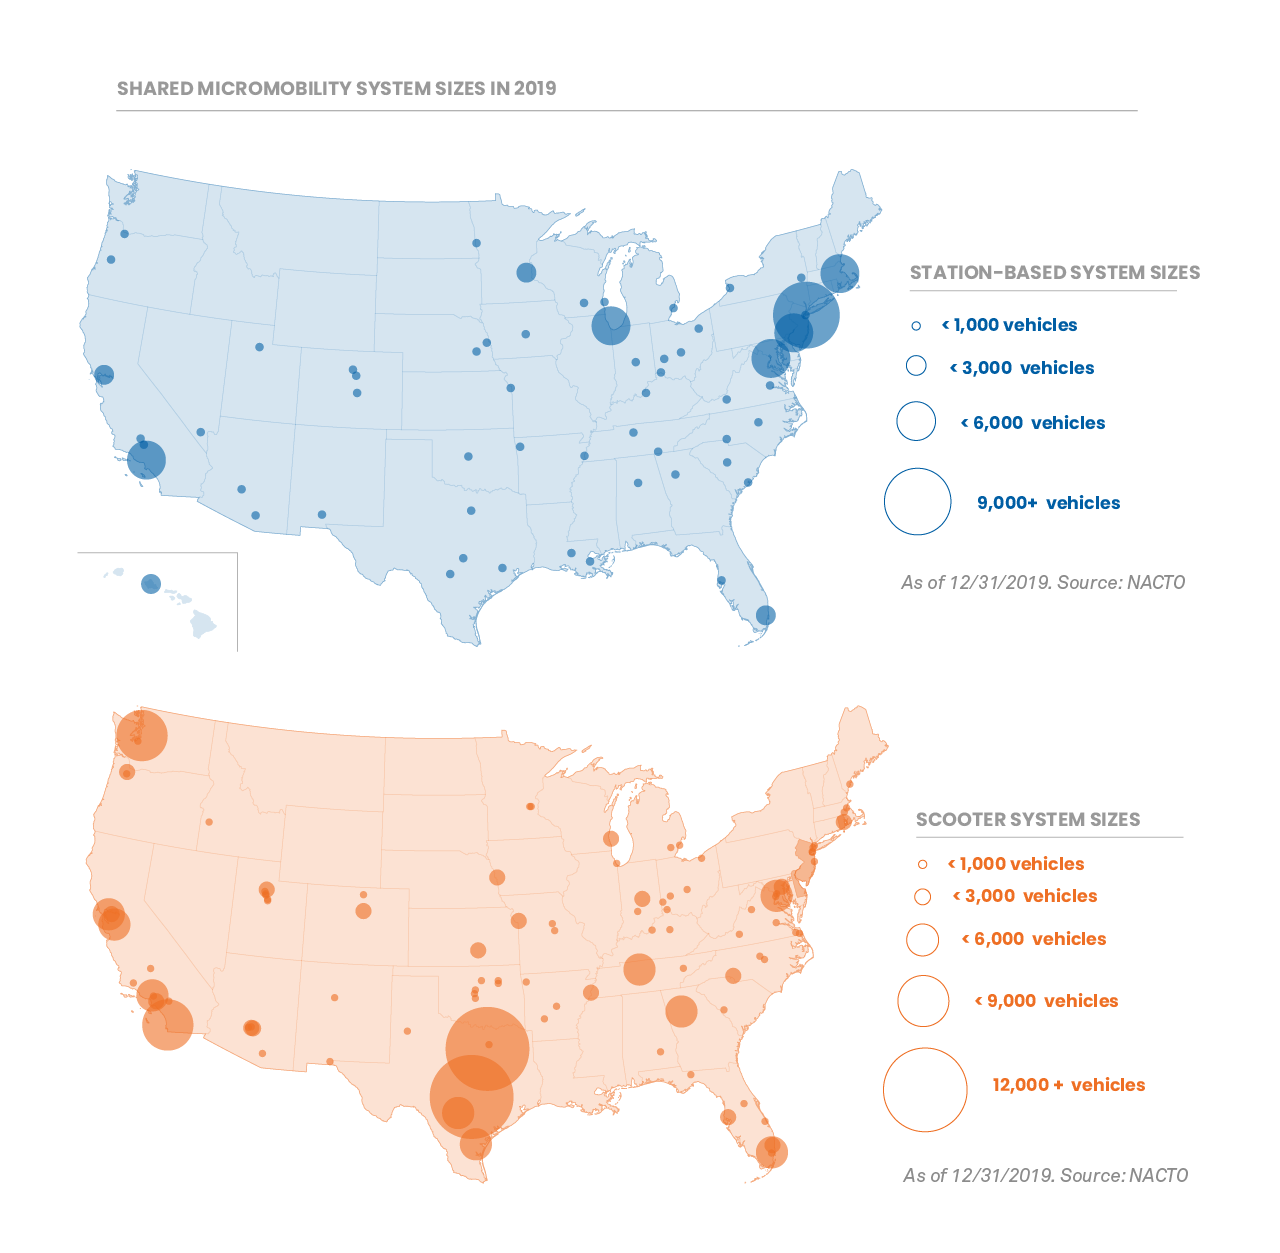
In 2019, people took 40 million trips on station-based bike share systems (pedal & e-bikes) and 96 million trips on dockless e-bikes (10M trips) and scooters (86M trips). In 2019, 109 cities had dockless scooter programs, a 45% increase from 2018. This contributed to an over 100% increase in trips taken on scooters nationwide. Scooter expansion was in some cases unstable, with scooter companies exiting markets at the end of the year (prior to the pandemic), possibly due to over-competition and other market pressures.
Total station-based bike share ridership increased 10% even as the number of systems decreased by 4% to 72.
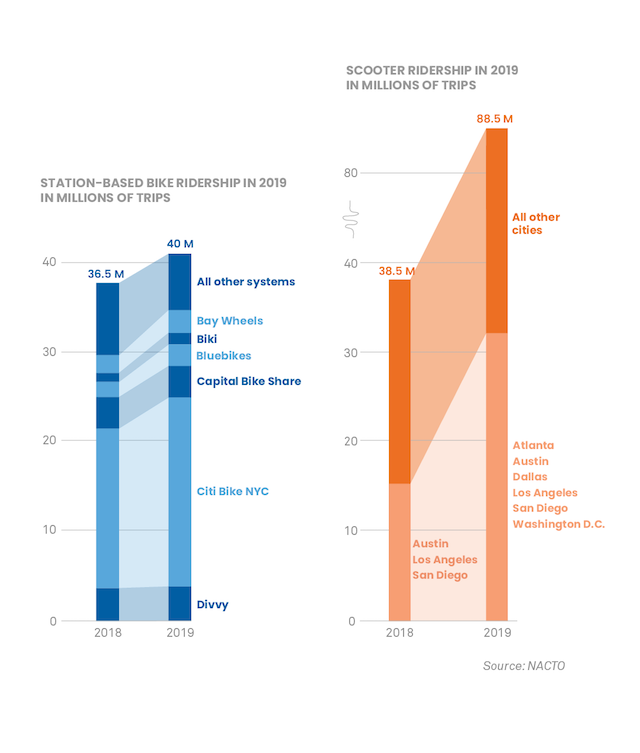
Ridership increases for bike share systems were largely driven by the largest, most-established bike share systems. Riders took 17% more trips on the 6 largest bike share systems than in 2018. In Boston, for example, the city expanded the Bluebikes system by 540 bikes and added 50 stations, resulting in a ridership increase of 45%. Smaller systems did not experience the same gains; while bike share ridership increased overall, driven by the largest systems, ridership declined in 75% of systems.
For station-based bike share, and to a lesser degree with scooter share, the majority of trips are largely concentrated in a small number of cities. In 2019, 87% of docked-bike share system trips nationwide took place in the top 6 ridership cities/regions—the Bay Area, Boston, MA, Chicago, IL, Honolulu, HI, New York, NY, and Washington, D.C. Ridership is more distributed for scooters, but 38% of all scooter share trips still took place in the 6 biggest ridership cities—Atlanta, GA, Austin, TX, Dallas, TX, Los Angeles, CA, San Diego, CA, and Washington, D.C.
Shared Micromobility Supports Short Trips
Bike & scooter share trips are short
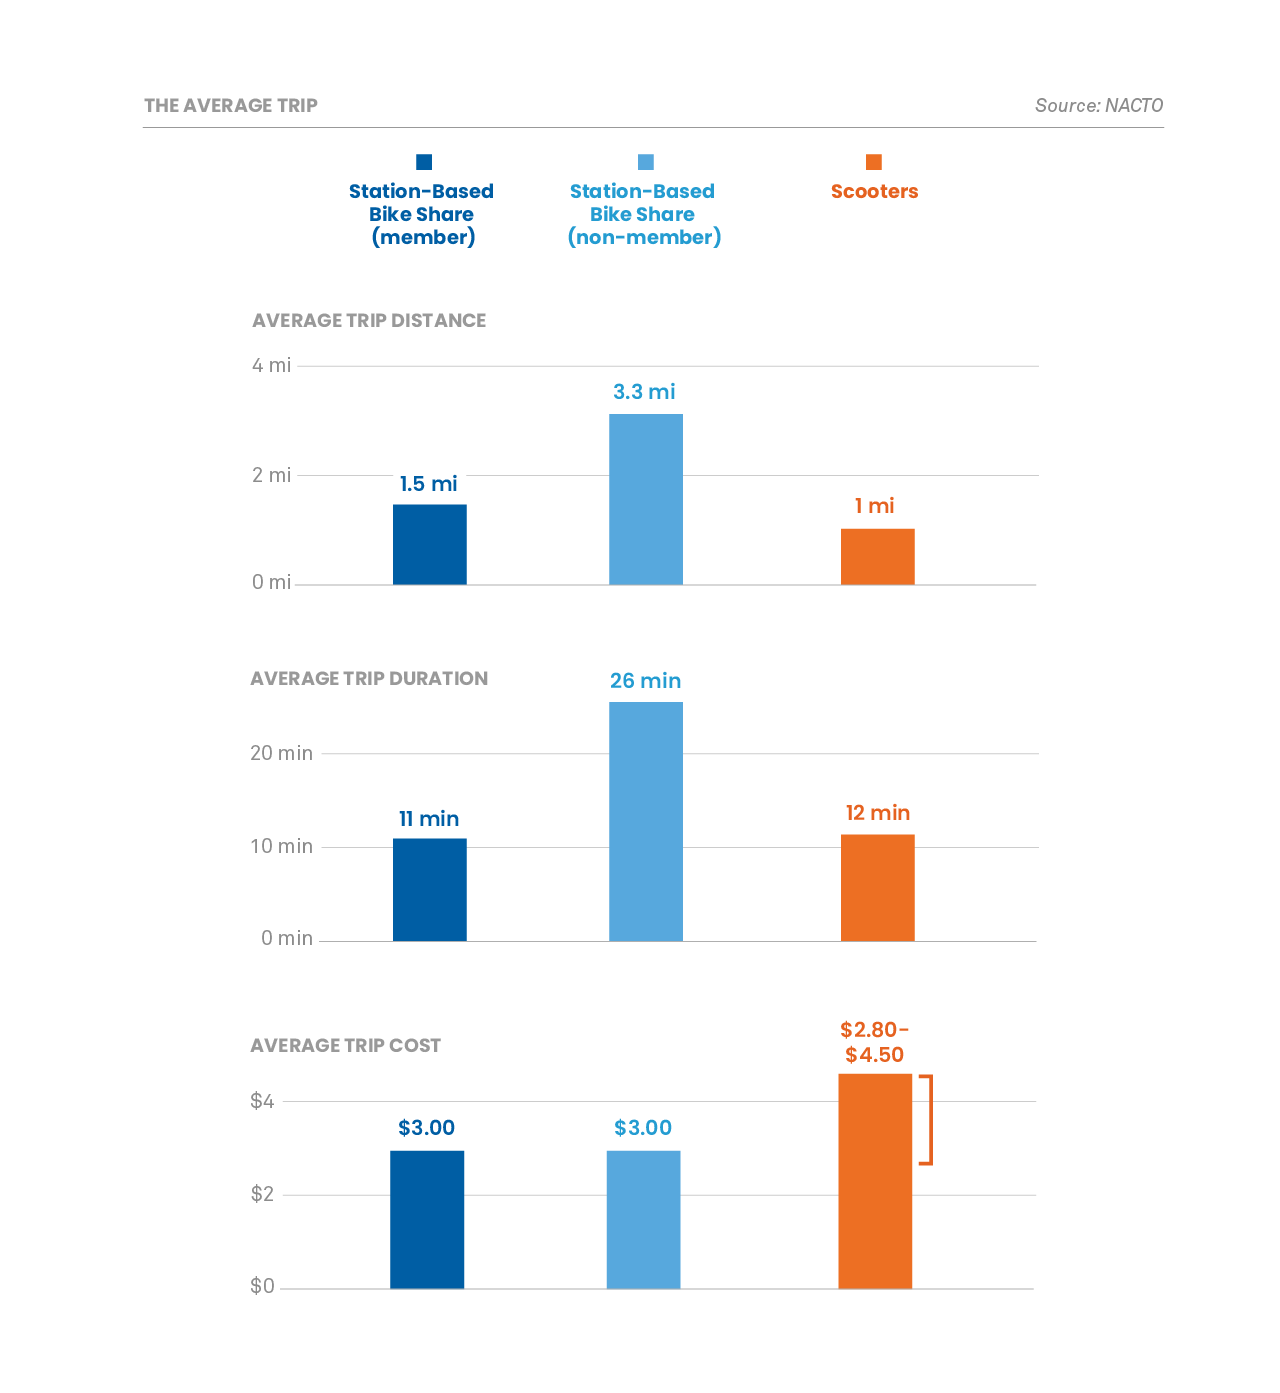
Shared micromobility provides people with more options for short trips. On average, the typical scooter user or bike share annual/monthly pass-holder rides for 11-12 minutes and 1-1.5 miles.
These short trips are important. As measured by the National Household Travel Survey, 35% of all U.S. car trips are under 2 miles. Building or supporting robust shared micromobility options can help people make these trips without relying on personal cars or taxis that cause congestion and contribute to climate change. Short shared micromobility trips can also complement transit services, expanding the number of people who can easily be served by each transit station or giving transit riders options to avoid transfers or overcrowding.
As noted in the 2018 Shared Micromobility Snapshot, there is a marked difference in bike share ride duration between annual/monthly pass-holders and casual/ single-trip/3-day pass riders. Looking at data from Washington, D.C., Boston, MA, Chicago, IL, San Francisco, CA, and New York, NY, the average trip duration for casual riders is 26 minutes versus 11 minutes for annual pass holders. Interestingly, ride times for annual pass holders in New York City are significantly lower than the national average, around 8 minutes.
Bike & Scooter Trips Are Replacing Car Trips
While there are currently no industry wide surveys on mode shift, survey data suggests that people are using shared micromobility to replace car trips. 45% of users in Santa Monica, CA, Alexandria, VA, Bloomington, IN, Brookline, MA, Hoboken, NJ, Oakland, CA, and San Francisco, CA report that if a shared dockless scooter had not been available, their trip would have instead been completed using a personal or ride hail vehicle. The second most reported transportation mode that shared micromobility trips replaced was walking trips at 28% and transit at 9%. Similarly, 55% of respondents to Capital Bikeshare’s 2016 annual survey reported that they drove less often since joining CaBi, and 65% reported decreases in taxi use.

User Prices Vary
Throughout the year, prices generally increased for dockless e-bike and scooter systems. Throughout 2019, users went from paying $0.15 per minute to a range of $0.15 to $0.39 per minute, in addition to the standard $1.00 unlocking fee, depending on the company. The average 12 minute scooter share trip costs $2.80 to $4.70 depending on the system.
For station-base bike share, prices have remained more constant. Most station based systems use a membership model, with unlimited monthly or annual passes available ranging from $100-$160/year, as well as single-ride options. In 2019, some station-based systems introduced new pricing structures for e-bike use. In New York City, for example, members are charged an additional $0.10 per minute, and non-members pay an additional $0.15 per minute for e-bike rentals. (There are no additional fees for standard pedal bikes, nor for e-bike use if it’s the last bike available in a station).
What We Saw
Cities continue to formalize shared micromobility to create better public outcomes
In 2019, cities increasingly turned to formal requests-for-proposals (RFPs) and competitive application processes to select and manage shared micromobility programs on city streets. This formalization has helped cities improve service quality, ensure better community relations, and create a more predictable market landscape for operators. As of December 2019, 21 of the 50 largest U.S. cities have used RFPs or some other competitive application process to determine which companies, and how many, are permitted to operate—a 60% increase from 2018. Many of these approaches are summarized in NACTO’s updated Managing Shared Micromobility guidance released in September 2019.
While the specifics vary, cities explored a number of regulatory approaches in 2019, such as RFP processes, limiting the total number of vendors allowed to operate in a city at the same time, limiting the number of vehicles or tying fleet sizes to performance, and offering fleet size bonuses to companies who provide service in low-income neighborhoods or places with limited transportation options. These tools are intended to create clear standards and reward high performing mobility providers.
Parking, parking, parking
Throughout 2019, parking for dockless shared micromobility was an ongoing challenge for some cities. Vehicles that are parked or toppled across sidewalks pose safety hazards for the general public, and create barriers to movement for people with disabilities. In Santa Monica, CA, and Alexandria, VA, for example, 42% and 75% of program complaints/citations were for improperly parked vehicles blocking sidewalks.
In 2019, cities attempted a variety of methods to ensure clear access. San Francisco, CA, for example, adopted a requirement that all scooters have the ability to be locked to existing street furniture, which led to an 83% drop in complaints of blocked sidewalks and citations for improper parking. A number of cities, such as Sacramento, CA and Seattle, WA have expanded their provision of bike racks, including on-street corrals, to provide more and better parking locations for shared micromobility vehicles.
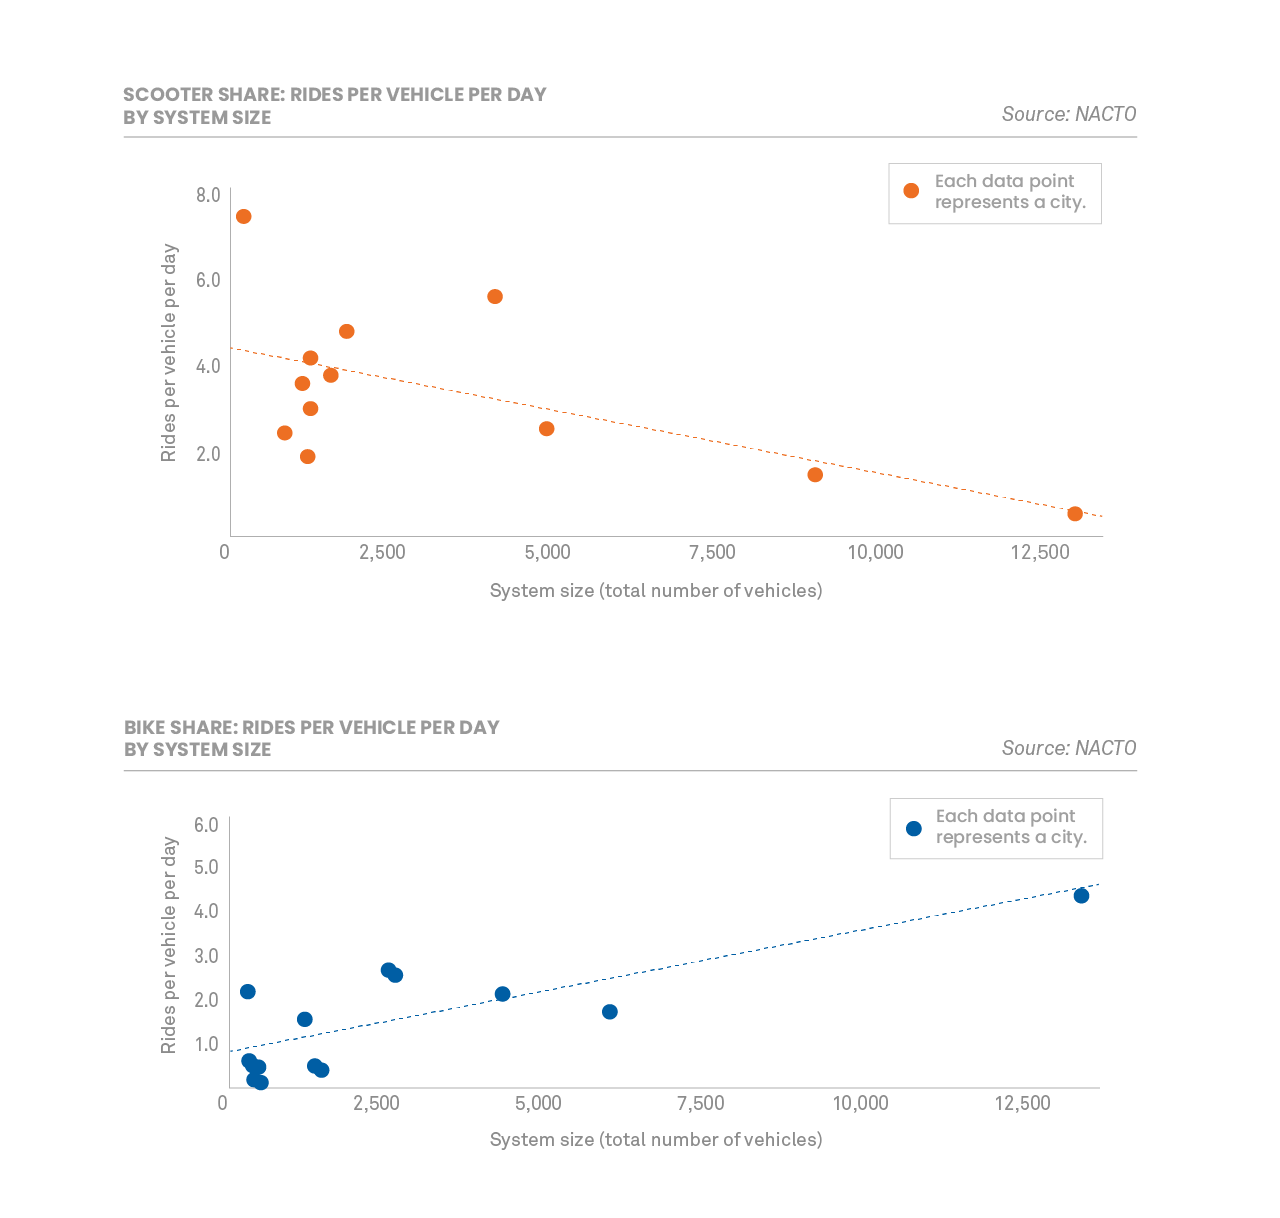
Exploring the relationship between trips and fleet size
Analysis of the intensity with which shared micromobility systems are used, rides per vehicle per day (r/v/d), reveals an interesting difference between shared scooters, which tend to be stationless, and shared bikes which tend to use stations. In general for station-based bike share systems, trips per vehicle per day increases with system size. Larger systems of more than 2,500 vehicles average around 3 r/v/d. Smaller systems, less than 2,500 vehicles, have an average r/v/d of 0.8.
For scooter share, the opposite relationship seems to hold true. In cities with smaller systems, the average utilization is around 4 r/v/d. This decreases to 2.6 r/v/d in cities with more than 2,500 scooters available. This pattern was also seen in the 2018 trip data. More research is needed to determine what an optimal r/v/d range is.
Making Streets safe for shared micromobility
Street conditions and comfort, or lack of comfort, with sharing space with motor vehicles can influence where and if people ride shared micromobility. In Alexandria VA, 53% of scooter users surveyed said that they prefer to ride in bike lanes over trails, sidewalks and streets, and 88% of surveyed scooter users in Hoboken, NJ said they would feel safer riding in the street if protected bike lanes were present. An early study of Citi Bike riders in New York, NY found that people using Citi Bike were disproportionately likely to ride in protected bike lanes for their trips. NACTO research suggests that when micromobility systems are combined with a robust network of interconnected bike lanes, they can help make streets safer for people biking, walking, scooting, and rolling.
2019 was a particularly deadly year for pedestrians, cyclists, and shared micromobility riders with at least 18 shared scooter fatalities and 2 bike share fatalities. To address these issues, cities across the U.S. are expanding their bike lane networks. For example, Atlanta, GA, committed to tripling its protected bike lane network over the next two years, prioritizing locations that have capacity for bike and scooter travel. Other cities are using scooter license fees to pay for essential roadway improvements. In 2019, Santa Monica, CA used the public right-of-way fees paid by operators to update 19 miles of existing bike lanes.
Who is Riding?
Demographic data is not commonly or uniformly collected by shared micromobility operators. To answer the question of “who is riding,” many cities conducted opt-in user surveys to help get a better picture of which communities are being served by micromobility systems. Opt-in surveys provide useful information but their accuracy is limited by how the surveys are distributed, who chooses to respond, access to technology, and other factors. Here are some highlights:
Age and Gender-Identity
Opt-in user surveys conducted by the cities of Santa Monica, CA, San Francisco, CA, Minneapolis, MN, Baltimore, MD and Austin, TX suggest that the user base of scooter share trends overall more young, and male than the general population. Across all surveys, the majority (66 – 81%) of surveyed users reported their gender identity as male, and more than half (50 – 73%) are under the age of 40.
Income
Income distribution varies by city. In Santa Monica, CA and Minneapolis, MN, for example, the income of the average scooter user seems to match area median income; about half of scooter users report incomes of $75,000 or more and the area median income for these cities is $75,000 and $77,000 respectively. In contrast, in San Antonio, TX area median income is $55,000 but about half of scooter users report incomes of $75,000 or higher.
Race/Ethnicity
Opt-in survey data also suggests that the racial and ethnic demographics of shared micromobility users vary from city to city, even for cities with similar demographics. For example, people of color (POC) make up the majority of the population in both Washington, D.C. and Baltimore, MD (63% and 72% respectively). Both cities’ Latine/x survey respondents report using scooter share at rates higher than their share of the population (DC: 1.5x, Baltimore 13.6x). Scooter usage amongst Baltimore’s Black population is on-par with the population ratio, and disproportionately higher for White residents while in the DC-region scooter-usage is less common for Black residents and consistent with the population share for White residents.
Cities removing barriers to access
Across the U.S., cities are exploring ways to reduce barriers to use by creating programs targeted toward low-income and communities of color. These programs typically increase bike share use among underrepresented communities through a combination of price discounts, targeted outreach, and neighborhood-focused rebalancing and operations plans.
Chicago’s Divvy for Everyone (D4E) program successfully combines targeted engagement and reduced prices to bring in new and more diverse ridership. Available to Chicago and Evanston residents, D4E offers $5 annual memberships, and the option to pay with cash. Divvy annual members who joined the system through the city’s D4E program are significantly more racially diverse than annual members as a whole. In a 2018 survey, the city of Chicago found that 28% of D4E users were African American/Black, 27% were Asian and 28% were White. In contrast, in a 2015 annual member survey, 79% of Divvy annual pass holders were White.
In Cincinnati, OH, the city’s Red Bike program focused on customer service and education, specifically tailored to the needs of those who are currently underserved or with limited transportation options. In 2019, discounted Go Program members accounted for 28% of all rides.
Other cities have put additional focus on operations and rebalancing of dockless vehicles to ensure equitable access for lower-income neighborhoods. In San Francisco, CA, the city set specific scooter rebalancing requirements so that people in low-income neighborhoods would have access to shared micromobility. To date, 52% of scooter trips in San Francisco began or ended in ‘Communities of Concern.’
A cohort of cities has also begun exploring ways to expand shared micromobility services to people with limited mobility. By the end of 2019, three bike share systems offered adaptive vehicle programs. For example, in Detroit, MI, the Adaptive MoGo program, now in its second year, offers 13 different cycles, available to the public on a reservation basis through a partnership with Wheelhouse Detroit, a local bike rental company. Oakland, CA piloted its Adaptive BayWheels Bike Share program during summer 2019. In Seattle, the city is subsidizing local non-profits to provide adaptive cycling services, using revenue from shared micromobility permits.
Looking Forward
At the end of 2019, the future for shared micromobility seemed promising, with record ridership and rapid expansion. Cities looked to improve management of shared micromobility, including experimenting with various regulatory structures such as licenses, permits, competitive bidding, and formal contracts. While new scooter companies continued to enter the market over the course of the year, a smaller number of major companies (Bird, Lime, Spin, Lyft, and Uber) controlled the majority of the market, suggesting that the market was stabilizing and companies could begin to focus more on differentiation through product quality and operations instead of focusing on quickly obtaining market share. For station-based bike share, the landscape was also strong, although more complicated, with big ridership increases in a few major cities but declines in many smaller markets.
Since 2019, the landscape for shared micromobility has now shifted in dramatic and unexpected ways. As a result of the world-altering COVID-19 pandemic, the total number of trips made in the US plummeted dramatically. In the last weeks of March and the first weeks in April, total US household tripmaking fell by as much as 68-72%, and nationwide, transit ridership was down by over 80% from the previous year. The number of trips taken on the eight largest station-based bike share systems decreased by an average of 44% in March-May, less than the decline in total trips in those cities.
COVID-19-related ridership declines have impacted the financial stability of shared micromobility. In many cities where shared micromobility service is provided via permit (e.g. companies apply to operate but are not contractually bound to remain), companies paused operations in March and April in response to plummeting ridership. For example, in mid-March, Lime reported a 69% decrease in global revenues over three days and the market valuation of many companies has fallen significantly. Two of the biggest shared micromobility companies announced significant and immediate layoffs in March 2020. For systems relying on spring renewals as a significant part of their revenues, the total decline in trip-making could have significant financial impacts.
Despite these new dimensions, the 2019 shared micromobility snapshot provides insights for how cities can reshape themselves, safely, equitably, and sustainably, as they slowly re-open.
In many cities, shared micromobility is emerging as a meaningful part of emergency response. Shared micromobility systems, especially those operating under contract with their cities, have expanded key operations to support city-led COVID-19 response measures. These systems, such as Citi Bike in New York, MoGo in Detroit, Austin B-Cycle, BayWheels in the San Francisco bay area, and Bluebikes in the greater Boston area, are offering free or discounted memberships to healthcare workers, adding new stations or valet services near hospitals, and enhancing cleaning procedures. In New York, for example, the busiest Citi Bike station in the system in the first week of April was the station adjacent to three major hospitals and overall system ridership in the first half of March was up 67% over the prior year as New Yorkers looked to avoid crowding on subways and buses. In Philadelphia, PA, Indego Bikeshare is offering a $5 monthly pass to all Philadelphians to help offset transit-service cuts.
The impending climate crisis has not gone away. Over the upcoming months, cities and transit agencies will have to grapple with the challenge of how to help people get around without increasing gridlock and vehicle emissions during a time when transit ridership is down and essential transit operating funding is imperiled. For short trips, shared micromobility offers a proven alternative to personal vehicle travel. Further implementation of interim sidewalks, bike lanes, traffic-calmed streets, and transitways can make this option safer and more comfortable for people, and continue to drive growth in micromobility trips.
In the first half of 2020, U.S. unemployment claims sky-rocketed to levels unseen in the U.S. for almost a century. With almost 30 million Americans newly unemployed, ensuring the availability of low-cost transportation options becomes increasingly important. Discounted shared micromobility membership programs, like Detroit’s AccessPass, Divvy4Everyone in Chicago or Citi Bike’s reduced fare program for SNAP recipients, can be expanded to help people get to job interviews, grocery stores, medical appointments, and other essential needs.
As the spread, impact, and repercussions of COVID-19 continue to unfold, what happens next is uncertain. What is clear, however, is that shared micromobility can play an important role in our recovery and path forward.
Methodology
NACTO counts all station-based bike and scooter share systems with over 150 vehicles. For purposes of clarity and analysis, smart bike systems, where the electronic components are incorporated into the bike itself, and use of a dock is optional, are included in station-based share counts throughout the report. Dockless systems (e-scooters, e-bikes) are counted as those that are designed to be free floating and do not required the use of a dock for operations. NACTO does not include bike library systems or systems that operate solely or mostly on closed campuses such as universities or corporate campuses.
Consistency and accuracy of data remains an ongoing issue. Cities have found discrepancies between what is reported by companies and what they find during spot checks. There is a growing conversation about data specifications and tools to audit and verify company-reported data.
Further Resources
Download report (PDF)>
Shared Micromobility in the U.S.: 2018 >
Bike Share in the U.S.: 2017 >
Bike Share in the U.S.: 2010-2016 >
NACTO’s Bike Share and Shared Micromobility Initiative >