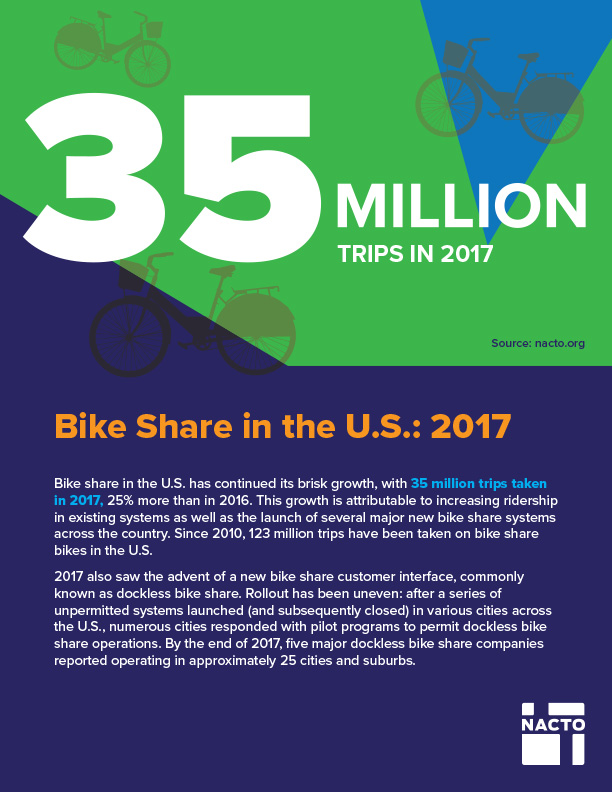
NACTO’s 2018 Shared Micromobility Report found that people took 84 million trips on shared micromobility in the United States in 2018, more than double the number of trips taken in 2017. More than twice as many trips were taken on shared micromobility compared to the year before.
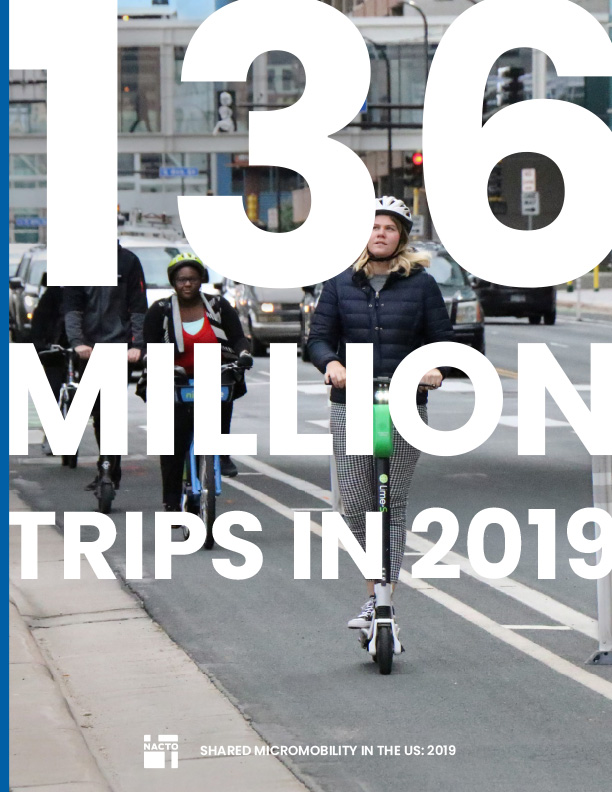
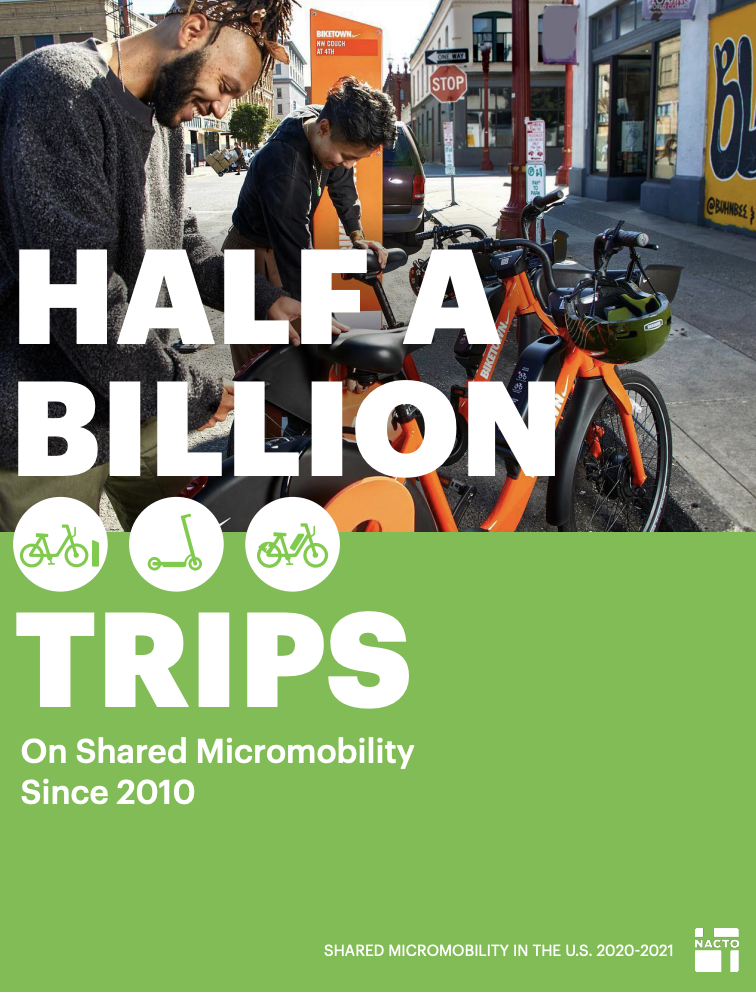
NACTO’s Shared Micromobility series analyzes data from across the U.S. and Canada, providing a yearly update on bike share, e-scooters, and other micromobility systems.