TRAFFIC SAFETY
Safety is a fundamental responsibility of city government. Streets should be designed to allow safe mobility for people walking, biking, taking transit, driving, making deliveries, or enjoying public space.
Stormwater streets, like all streets, should be evaluated for their traffic safety results. Green stormwater infrastructure should incorporate, and be incorporated into, street designs that advance Vision Zero goals to eliminate traffic fatalities and serious injuries. Evaluating safety is important in both building the case for future projects, and evaluating the design details of existing projects.
In the design process, analyze crash counts by location and crash type (e.g. rear-end collisions, turning vehicle collisions, crashes between modes). Work with police departments to simplify data collection and reporting as needed. Crash locations should be geocoded as accurately as possible to understand locations where crashes are more frequent. In evaluating projects, it may be difficult to determine whether crashes are related to green infrastructure. However, crash patterns at a location indicae that further design attention may be necessary.
An important, discrete metric to study is the number of people killed or severely injured (KSI) on city streets. At a corridor level, collect data about fatalities and injuries over a multi-year period (~3 years) to gather an adequate sample size to understand risk conditions before and after project implementation.
Speeding is one of the key issues related to unsafe streets, and a leading indicator of design’s safety results. Green infrastructure should be implemented as a traffic calming strategy, creating safe places for people while reducing motor vehicle speeds. Evaluate whether street redesign projects have reduced the number and frequency of speeding vehicles. 85th percentile speed is commonly used, but 95th percentile speed is a more accurate measure of the most dangerous speeding behavior.
MOBILITY
On a project level, green infrastructure projects can be implemented alongside street improvements that support active transportation, such as transit boarding bulbs or protected bikeways. These investments enhance biking and walking access or transit service quality, and may improve or maintain overall traffic flow by organizing street operations and reducing turn conflicts.
Average transit travel time through project segments can be important to identify benefits from transit-supportive street design projects. Stop-level boarding data and stop delay time are necessary to evaluate the granular benefits of more efficient transit boarding and in-lane stop configurations. Analyze changes in motor vehicle travel speed to build a complete picture of mobility outcomes.
Shade trees and vegetated planters improve the experience of people waiting for a bus or train, providing a more hospitable human environment at transit stops. Conduct rider surveys to collect qualitative data about experience at transit stops before and after GSI implementation.
SUSTAINABLE TRANSPORTATION
Integrating GSI into streets can be part of a comprehensive strategy to reallocate unused or underused street space to sustainable travel modes: walking, biking, and transit.
At a project level, collect and analyze mode share, or the number and percentage of people on a corridor traveling by each mode, especially for projects that include pedestrian, biking, and transit infrastructure improvements. Track changes to each mode separately as well, indicating whether a large increase has occurred in a newly served mode. Successful GSI projects enhance the public realm and encourage sustainable travel mode choices.
ACCESS & ACTIVITY
For many projects, success hinges on maintaining access to local destinations and businesses, and changes to on-street parking are often part of the discussion. Measure parking utilization to determine where parking demand is low and curbside space is easiest to repurpose for green infrastructure.
When reallocating street parking for bioretention, calculate parking spaces not just on the project corridor but also within 1 to 2 blocks, located on- and off-street, that are available for destination access. For instance, 50% parking loss on a project street may only constitute 1–2% of total parking availability within a block. Distinguish between changes in high-value loading zones, moderate-value metered parking, and lower-value storage parking.
Conduct public space canvasses to identify user patterns of streetscape improvement projects, and identify successful strategies for increasing social activity.
| San Francisco, CA |
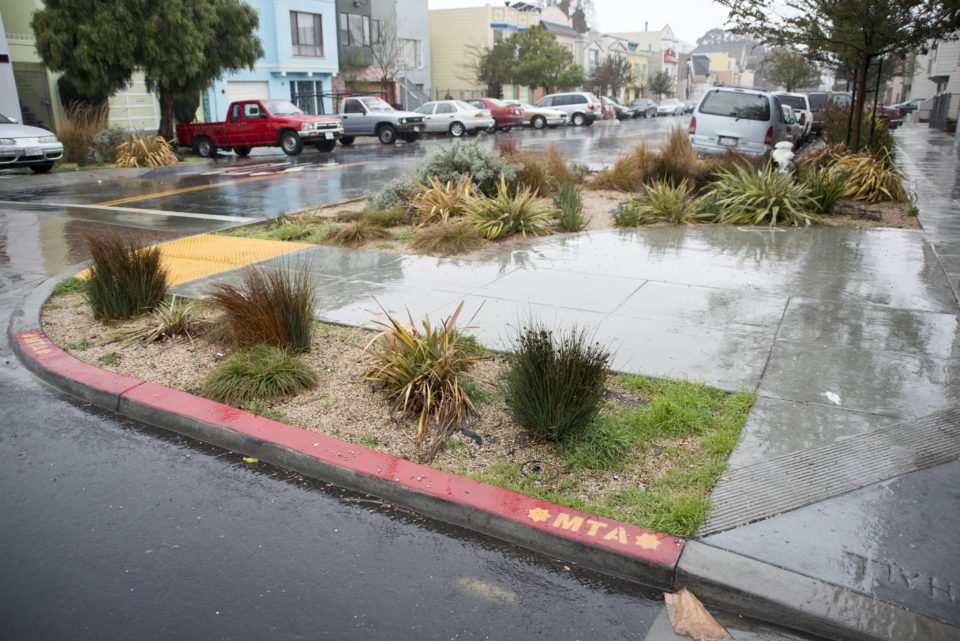
 Newcomb Ave (SFPUC) The sustainable streetscape project on Newcomb Avenue is not only reducing peak stormwater flow rates by 72–83%, but has reduced 85th percentile speed 3 mph in each direction and halved the volume of motor vehicle traffic cutting through this neighborhood street. |