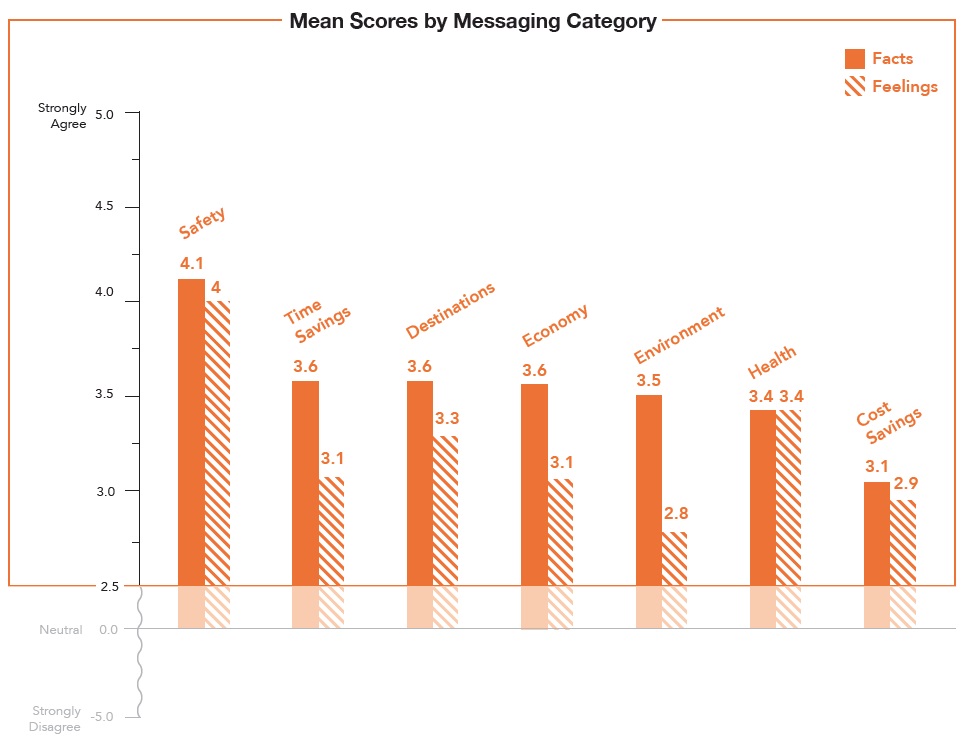
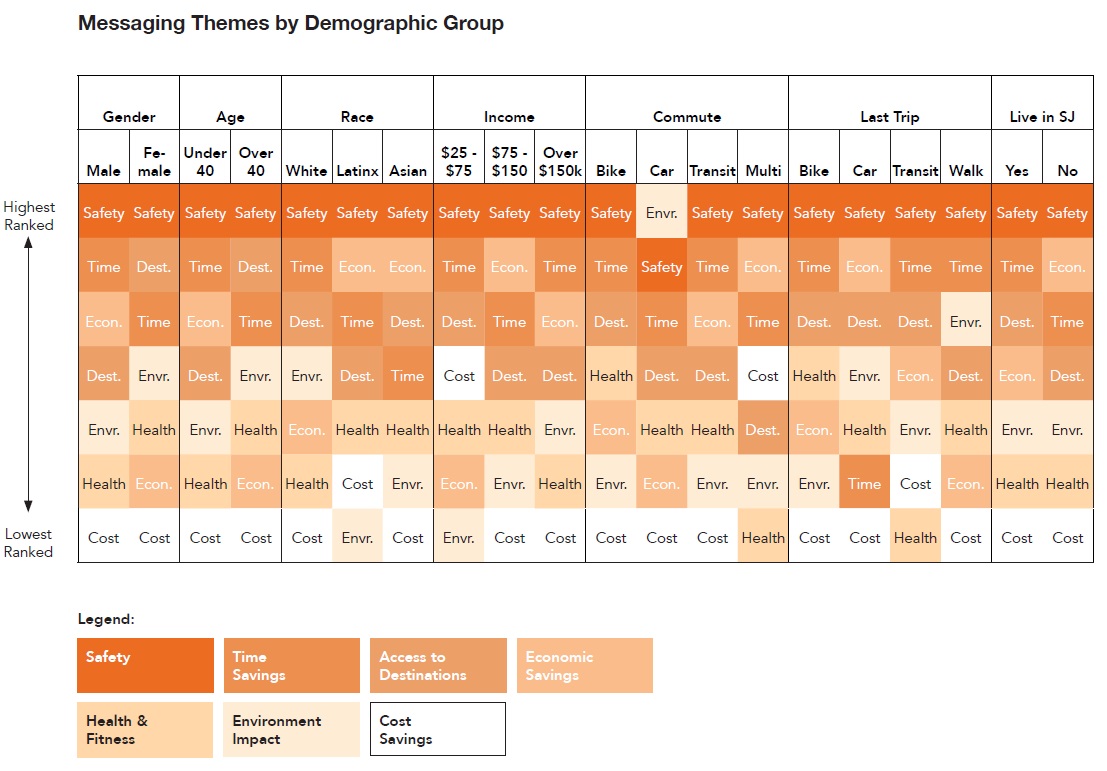
Among the primary messaging themes, Safety consistently polled the strongest across all demographic groups and breakdowns (e.g., mode used for last trip, San José residency, etc.). Respondents in all demographic groupings rated Safety messages higher than other themes, suggesting that San José should focus on creating a compelling narrative around how the new protected lane network will enhance personal safety. Additionally, Time Savings, Economic Impact, and Access to Downtown Destinations scored positively among most audiences, though responses were nearly uniform in support of Safety messages. Importantly, Cost Savings, which is sometimes suggested as a strong case-making message, scored worse than the other six message options.

Age emerged as one of the dividing lines in message acceptance, with people over age 40 less likely to respond positively to any messages other than Safety. Literature review of cycling acceptance suggests that older people are less likely to support cycling infrastructure or respond positively to bicycle messaging. This was borne out in our survey with the exception of Safety messages, reinforcing the idea that as San José markets the Better BikewaySJ project, Safety should be a prime message, especially with older populations.
San José residents who drive were mostly positive about each of the messages tested, and considerably more positive about bike messaging than non-San José drivers. In general, respondents who live in San José were similarly receptive to all messages as non-San José residents. However, people who drive to work and do not live in San José rated messages ~16% lower on average (and rated individual messages between 7 and 20% below the mean). Drivers living outside San José are an outlier among demographic groups, as drivers living in San José scored messages nearly at the mean for all responses. Economic Impact and Cost Savings messages tested the lowest among drivers.

The survey under-represents some demographic groups, and the City will have to work creatively to capture a demographically representative sample of the San José population. The survey was disseminated both online and in-person, with online participants comprising two-thirds of all responses and responses generated at public meetings and through flyering representing the other third. In spite of this mix of engagement methods, the responses gathered do not fully reflect the residents of San José. For example, about 43% of San José residents earn less than $75,000/year but only 22% of survey respondents do. A disproportionately small number of people who identified as Latinx (12% respondents vs. 33% citywide) or Asian (11% respondents vs 34% citywide) responded to the survey, suggesting that considerably more engagement work is necessary to create an accurate portrait of San José resident preferences.
Online respondents were somewhat more diverse, and more representative of the city of San José, than responses gathered in person at public meetings. While still over-representing white and wealthy, responses generated through social media-based engagement performed better than in-person responses in representing the racial composition of San José (36% non-white respondents from social media vs. 30% from in-person outreach, compared to a 73% citywide composition), and was less skewed toward the highest-income group (50% of in-person responses vs. 44% of social media responses, compared to 27% citywide). Social media extended the reach of engagement in crucial ways, but still possesses limitations for reaching a fully representative sample of San José residents.