HEAT ISLAND EFFECT
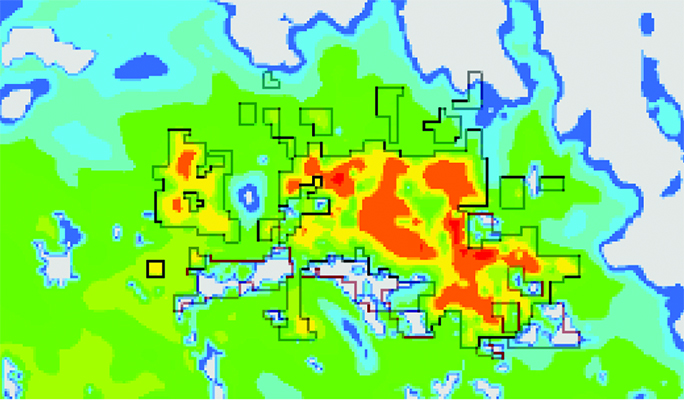
Urban heat islands, which can be significantly warmer than surrounding rural areas, are linked with an increase in heat-related illnesses. The urban heat island effect also drives an increase in energy demand for air conditioning, thereby increasing energy bills and energy-related greenhouse gas emissions. The urban heat island effect occurs in dense areas with high percentages of land cover that absorb or hold heat, such as pavement, buildings, or other hardscape.
Temperature data is not a direct indicator of GSI performance, but can provide clues to inform future GSI system designs to better reduce local temperatures through evapotranspiration and shading.
Measuring reductions in the urban heat island effect requires a combination of techniques, including measuring the energy reflected and emitted from various surfaces in cities, as well as air temperature measurements.
| Phoenix, AZ |

Phoenix, which has a dramatic urban heat island effect resulting in city temperatures that are 15 degrees warmer than adjacent desert and farmland, charted an ambitious roadmap to plant urban forests and street trees. Phoenix aims to achieve an average 25% shade canopy coverage for the entire city by 2030 as part of a strategy to address the urban heat island effect, decrease energy consumption and costs, reduce stormwater runoff, and contribute to a more pleasant public realm. |
PUBLIC HEALTH
Greening in urban environments has been attributed to improving mental, physical, and social well-being.
Water quality improvement is usually the most significant and directly observable public health benefit from green infrastructure programs. Measuring reductions in combined sewer outfall events, as well as the presence of pollutants, harmful bacteria, and metals in regional surface and groundwater are basic components for monitoring and communicating program efficacy.
Air quality is also readily measurable in the urban environment; trees and vegetation absorb air pollutants and intercept particulate matter from the atmosphere that cause chronic diseases such as asthma. Measure indicators in the atmosphere such as nitrogen dioxide and street-level particulate matter.
Cities can work with institutions or public health researchers to understand the diverse human impacts of greened streets. Monitoring changes to asthma rates and heat-related illnesses among nearby residents may indicate changes to the physical health impacts of streets.
Additionally, as streets become more inviting to active use, health indicators such as obesity and cardiovascular disease can verify the benefits of more active urban environments.
Finally, mental health can be improved by urban green space; proximity and access to urban green spaces reduce stress and anxiety. Survey street users to understand how they perceive greened versus unimproved streets, documenting how they react to or perceive stressful events, with or without green spaces.
EQUITY
An equitable green infrastructure program distributes green space among neighborhoods with a conscious recognition of the need to avoid harm to vulnerable people, as low-income neighborhoods have historically borne a greater risk for exposure to pollution and toxins. Any negative impacts, such as flooding, must not be disproportionately borne by one community.
Analyze the spatial distribution of GSI facilities and tree canopy and assess whether resources are being invested equitably. Use flooding models to supplement information from the public (such as 311 calls or constituent complaints) to inform and select project locations, and ensure that projects are being implemented across neighborhoods regardless of socio-economic factors.
| Portland, OR |
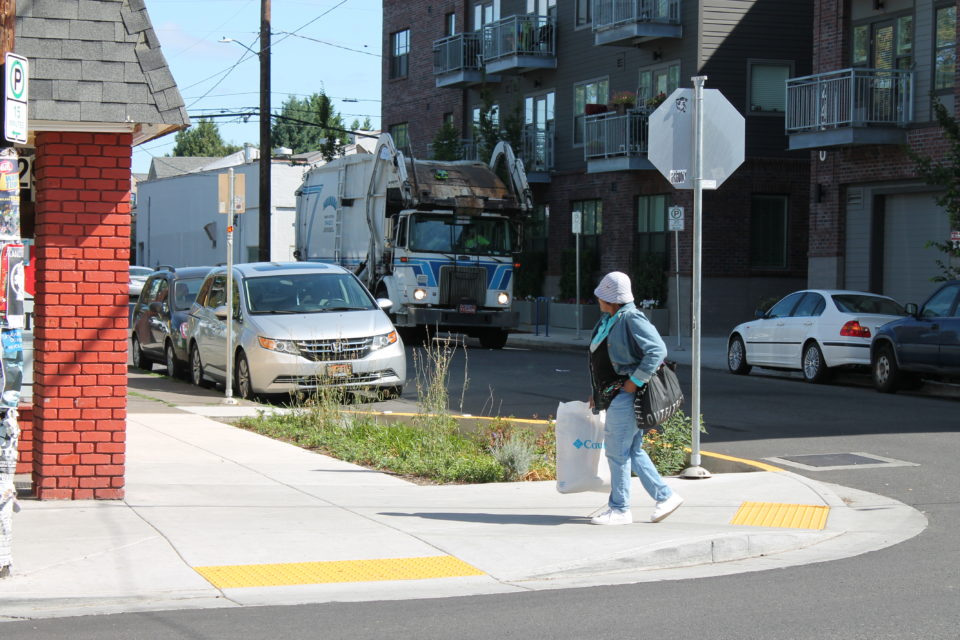
 SE Division St (Metro) Portland’s Bureau of Environmental Services completed a report in 2010 documenting the impacts of its Gray to Green program on residents using a wide variety of social and economic indicators. Researchers found broad improvements to resident satisfaction, economic value, and air and water quality around green project locations. |