search menu flickr twitter phone angle-left angle-right angle-up angle-down file-pdf link-ext doc-inv sitemap location map calendar credit-card clock facebook-squared minus plus cancel ok instagramm download inkwell

Shared Micromobility in 2022

Read the report (pdf).

730 million trips on shared bikes and e-scooters in the U.S. and Canada since 2010.

Shared micromobility has become an ever-more integrated and indispensable part of urban transportation systems across North America. Bike share and e-scooter systems are taking cars off the road, reducing greenhouse gas emissions, and getting people where they need to go–to all the opportunities in the cities they live in.

NACTO’s 2022 Shared Micromobility in the U.S. and Canada Report examines data from across North America and finds that shared micromobility has ushered in a transportation revolution, providing safer, cheaper, and more accessible ways for people to get around. The report also notes the work that remains to ensure that shared micromobility devices are affordable and accessible to everyone, including prioritizing equitable distribution and pricing.

Building on previous reports, this year’s Shared Micromobility Report examines data from across North America to identify the changes and trends that that have emerged in the past year, and the key factors that may shape shared micromobility programs in the years ahead.

Read the full report (pdf) or check out some highlights below.


The Numbers

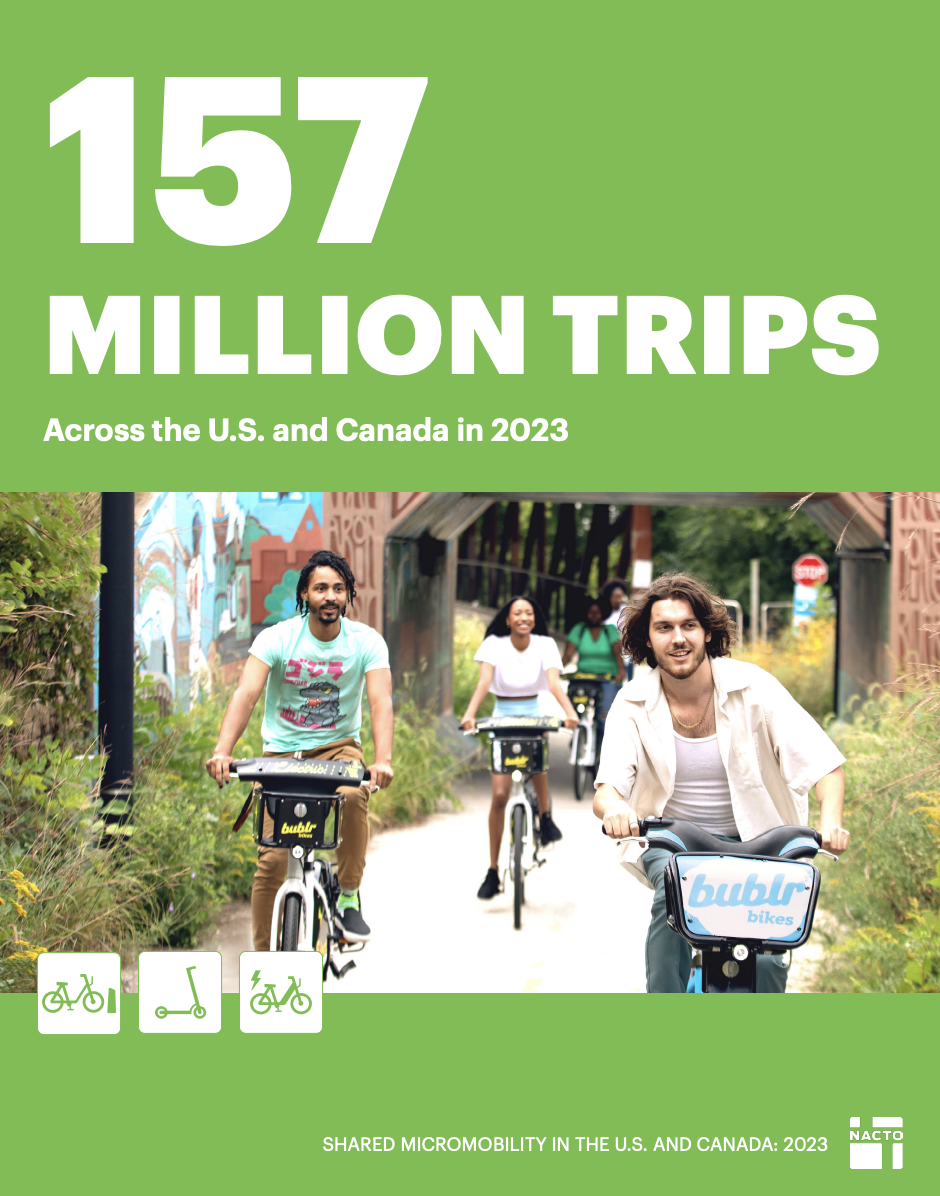
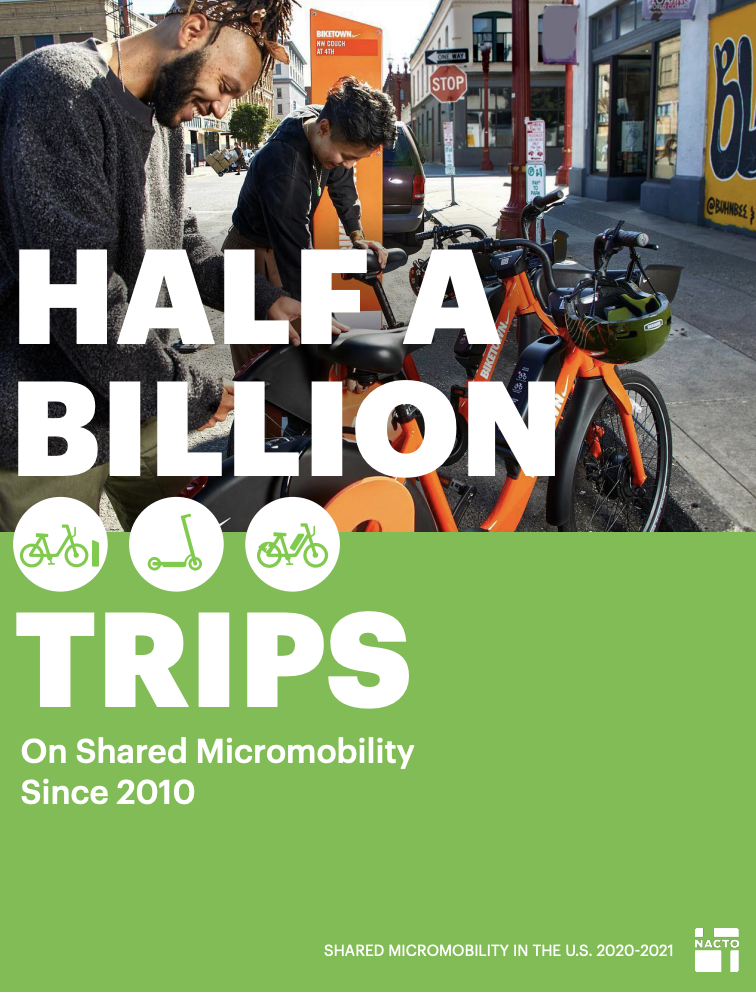
Overall, riders took 130 million total trips on shared bikes and e-scooters in the U.S. and Canada in 2022. Shared micromobility trips are up by 40% since 2018, and have increased 35-fold from 2010. 113 million of these trips were taken in the U.S., and 17 million were taken in Canada. Since 2010, people have taken 730 million trips on shared micromobility in the U.S and Canada.

How a system is designed, how accessible it is, and how well the availability of bikes and scooters align with where a rider wishes to go create vastly different outcomes in daily use from city to city. Average utilization–the average number of rides taken on a shared device each day–shows some broad trends, but there is substantial variation due to local operating conditions and system make-up. On average, shared micromobility devices see 1.1 rides per vehicle per day (r/v/d), but this rate ranges from as low as 0.1 r/v/d in some cities to as high as 8.0 r/v/d.

Station-based bike share systems continued to see robust and increasing ridership, with 67 million trips taken in 2022, a 17% increase from the previous year. 52 million of those trips were taken in the United States, and 15 million were taken in Canada. Station-based bikes made up a third of shared micromobility devices available in the U.S. and Canada, yet accounted for over 50% of all shared bike and e-scooter trips. Continued expansion of the largest systems, particularly in Canada, and a sustained interest in e-bikes, drove much of the station-based bike share ridership growth in 2022.

Dockless e-scooter trips dropped by 10% in 2022, as a number of companies shuttered operations in North American (and European) markets. These closures were largely due to ongoing financial struggles or a shift in company-wide operating priorities. People took 58.5 million trips on dockless e-scooters in 2022, compared to 65 million in 2021. 56.5 million of those trips were taken in the U.S., and 2 million were taken in Canada. Dockless e-scooters accounted for nearly two-thirds of all devices, but less than half of total trips taken on shared micromobility.

There were 4.5 million total trips on dockless e-bikes, a 73% increase from 2021. This substantial growth in dockless e-bike trips suggests the popularity of e-bikes is widespread across shared micromobility users. However, despite the large percentage increase in trips on dockless e-bikes, they remain a small portion of total shared micromobility trips, making up only 3% of all shared micromobility trips and 6% of shared micromobility devices in 2022.


Major Trends

Collaboration is key for an equitable and resilient shared micromobility program

Shared micromobility systems that see consistent growth and equitable outcomes are typically municipally-owned or closely managed through long-term partnerships with private operators. Long-term contracts have resulted in more sustainable results for ridership and the durability of systems. The enduring viability of private sector operators remains uncertain, especially as companies with short-term permits respond to financial troubles by pulling out of cities–often abruptly–altogether. Shared bikes and e-scooters can and should be integral parts of a city’s transportation network, but that is only possible if they are consistently available and resistant to the volatility of market conditions. Partnership models where local governments have greater involvement in their shared micromobility programs generally lead to better outcomes, like more equitable pricing structures, greater investment in historically underserved communities, and ultimately, a greater likelihood of long-term viability.

The five longest-running and most heavily-used shared micromobility systems in the U.S. and Canada–BIXI (Montréal), Bluebikes (greater Boston), Capital Bikeshare (greater Washington D.C.), Citi Bike (NYC, Jersey City, and Hoboken), and Divvy (Chicago and Evanston)–have successfully operated as public-private partnerships (or in the case of BIXI, a city-run non-profit) for over a decade. Shifting priorities amongst private-sector operators, however, have raised questions about the durability of the current operating model of some systems.

Other cities have begun to refine the management and ownership structures of their shared micromobility programs in an effort to ensure accessibility and long-term viability. Most recently, New Orleans, Pittsburgh, and Denver completely restructured their shared micromobility programs with these priorities in mind, aiming for more sustainable operations, equitable distribution of devices, and affordability–especially with the rising costs of electric bikes and e-scooters.

Investments in infrastructure, like dedicated bike lanes and adaptive bike options, pay off

Studies from across the U.S. and Canada show that more people ride when cities build high quality, protected bike lanes. There are examples from across North America. Montréal has set the standard as North America’s top biking city. The 140-square-mile city boasts 560 miles of bikeways, with approximately 80% (445 mi) available all year–even through the snowy winter. Since the launch of Bixi in 2009, the city has seen steady year-over-year growth of bike share ridership in the millions with almost 9 million trips in 2022, an increase of over 3 million trips from the previous year. Between 2018 and 2021, Austin, TX built 100 miles of new bike lanes, including 22 fully or partially protected intersections. Austin continued to be one of the top U.S. cities for shared micromobility ridership in 2022, with 3.4 million trips on dockless bikes and e-scooters and over 300,000 trips on station-based bike share.

Many cities across the U.S. and Canada also took steps to make shared micromobility more accessible by offering adaptive bike options. In December 2021, MoGo Detroit hosted a virtual adaptive bike share workshop in collaboration with the Center for Disability Rights. During the two-day convening, transportation workers shared best practices and learned how they–and shared micromobility programs–could better serve the disabled community. Throughout 2022, Seattle, Portland, OR, Reno, NV and Milwaukee expanded their existing adaptive bike options, while Hamilton, ON and San Francisco both launched their first adaptive bike share programs through joint partnerships with community organizations.

To keep shared micromobility affordable, cities must set clear goals for pricing and price equity

The cost to ride a shared bike or scooter continues to rise in numerous cities, posing a threat to affordability. In a year of widespread consumer price increases–including public and private transportation modes–shared micromobility was no exception. Annual membership hikes, alongside rising e-bike surcharges, led to a 70% increase in average per-trip costs for members of station-based bike share systems from the previous year. Pay-as-you-go trips on e-bikes or e-scooters were the most expensive, with average per-trip costs more than double the typical fare of a one-way trip on public transit in the U.S. and Canada.

These increases come alongside a trend of systems shifting from flat-rate pricing of $2 to $3 for 30-60 minute rides (or unlimited monthly pricing) to charging by the minute. While a few cents a minute sounds cheap at first, the costs add up quickly: a 20-minute, one-way trip that may have cost $2.50 a few years ago can now cost $6 or more.

Pay-as-you-go riders on dockless bikes and e-scooters paid, on average, $0.20 cents more per minute than station-based bikeshare members, resulting in an additional $2.40 for a 12 minute trip. For longer trips, the differences in price are even more stark: A 30-minute trip of 2-4 miles would cost, on average, $2.30 for members of a station-based bike share system ($6.80 on an e-bike), $4.80 for non-members ($8.60 on an e-bike), and $12.00 on a dockless bike or e-scooter.

Reduced fare options help expand access

Monthly or annual memberships are still the most affordable way to pay for shared micromobility for the majority of riders, and income-eligible membership programs offer even deeper discounts. The average cost of discounted memberships–when not entirely free–is around $3.25 a month, with some costing as little as $5 for the entire year. For station-based systems, memberships usually include unlimited rides (ranging from 30-60 minutes) and reduced surcharges for e-bikes. For dockless systems–which use unlock fee plus per-minute fee pricing–income-eligible memberships often waive or reduce unlock fees, and offer discounted per-minute pricing.

As shared micromobility systems begin to shift price structures and add more e-bikes, affordable access has become critical. Riders using reduced-fare passes are two times more likely to use e-bikes than pedal bikes, and shifts to per minute pricing mean that previously-affordable trips are often now more expensive, especially for people traveling from further neighborhoods into urban cores.

Shared micromobility must remain affordable to all, not just those within specific programs. Providing income-eligible pricing is a key component of establishing equitable pricing options. However, shared micromobility also needs to remain affordable to the broader public. People navigating cities without a car are making a choice based on time and money. For short trips, shared micromobility is often faster than waiting for the bus. However, if a shared micromobility trip is significantly more expensive than riding the bus, particularly if it is used to connect to transit, it may not be a realistic option for price-sensitive customers.

It’s Electric: The E-Bike Boom Continues

The e-bike boom of the past two years continued into 2022, particularly on station-based bike share systems. Three-fourths of station-based systems across the U.S. and Canada expanded the number of e-bikes in their fleets, and in the U.S. alone, total station-based e-bike trips increased by 38% from 14.5 million trips in 2021 to 20 million trips on e-bikes in 2022. Station-based e-bikes were only 9% of available shared micromobility devices in the U.S. and Canada in 2022, yet accounted for 24 million–18%–of total trips taken on shared micromobility.

The greatest increase in station-based e-bike trips from 2021 occurred in Chicago (41%), New York City (32%), Philadelphia (30%), and the San Francisco Bay Area (28%). In San Francisco, over two-thirds (70%) of station-based trips taken in 2022 were on e-bikes, a continued trend from 2021 when 68% of trips were taken on e-bikes. In New York City, Jersey City, and Hoboken, 39% of trips were made on e-bikes, despite making up only 20% of the regional Citi Bike fleet. Richmond and Boulder shifted to entirely electric station-based fleets in 2021; by the following year, trips in Richmond nearly doubled, and in Boulder, ridership grew from an average of 100,000 rides annually to almost 500,000.

Even as 9-5 commute patterns return, people are using shared micromobility for far more than work trips

Mobility patterns on shared micromobility devices have shifted greatly over the past three years, with shared bikes and scooters becoming an integrated–and integral–part of people’s lives. Between the return to offices throughout 2021 and 2022, expansions of bike networks, and increasing interest in shared bikes and scooters, shared micromobility options have become valuable transportation options for millions of people. People across North America use these systems to get to work, school and doctors appointments, as well as restaurants, local businesses and cultural institutions, helping to build community connections and generate economic activity.

Following two years of record-low travel for 9-5 workers in 2020 and 2021, spikes in travel during the morning and early evening peak commute times reappeared for annual and monthly passholders using station-based bikeshare. Travel patterns for pay-as-you-go station-based bike share users and dockless e-scooter users remained similar to past years, with trips more evenly spread throughout the midday and PM peak periods.

Throughout 2022, people continued to use shared micromobility to reach a wide range of destinations and for a variety of trip purposes. In an analysis of some of the largest shared micromobility systems in the U.S., many riders reported they used shared micromobility for multiple purposes over the course of the year: 34% of riders use shared micromobility to access jobs, 39% use shared micromobility to run errands, 16% use shared micromobility to get to school, and 50% of riders use shared micromobility for other social or recreation trips.

It’s not just about getting to where you need to go efficiently: Using shared micromobility is fun! At the end of 2021, riders in Seattle reported that the top reason for using shared micromobility was to get places quickly, and the second most common reason was because riding is fun and relaxing.

Looking Forward to 2023

There’s no doubt that shared bikes and e-scooters are popular and highly valued in the U.S. and Canada. When working hand in hand with the communities they serve, shared micromobility systems see better outcomes, like more availability in historically underserved neighborhoods, and the trends present in this report show that cities in the U.S. and Canada are working hard towards a collaborative future for their shared micromobility programs.

In the coming years, shared bikes and e-scooters will be further cemented as an integral part of cities’ transportation networks as shared micromobility systems that have historically operated on a seasonal basis move towards year-round operations. The recent launch of a year-round BIXI pilot in Montréal could usher in the possibility of winter biking for even more people in the U.S. and Canada, as seen already in other cold-weather cities (albeit not quite as cold and snowy) like Chicago and Toronto.

There is still work to be done to ensure that shared micromobility devices are affordable and accessible to everyone. As more systems and operators shift to offering e-bikes, prioritizing equitable distribution and pricing will continue to be a top concern, especially with many systems financed by for-profit tech companies facing uncertainty of operations. Shared micromobility can be an extraordinarily competitive and reliable transportation option for short trips, but only with holistic planning, clear policy and goal-setting, and close collaboration between cities and operators.

The increasing popularity of bikes and scooters also necessitates new thinking on how we design our streets, including adding wider bike lanes that accommodate more people traveling at different speeds. One billion trips on shared bikes and scooters is just around the corner, and cities that form strong partnerships with both their operators and the communities they serve will be the ones that lead the way.

Additional Resources

Download report (PDF) >
NACTO’s Bike Share and Shared Micromobility Initiative >