NACTO is excited to release findings from the inaugural NACTO City Data Snapshot (pdf). These findings are the result of a data collection effort that began in January 2018 and concluded in June 2018, in which NACTO asked all member cities to complete a brief snapshot that asked about recent accomplishments, current activities, and organizational structure. Thirty cities completed the snapshot, and their results are included in the analysis.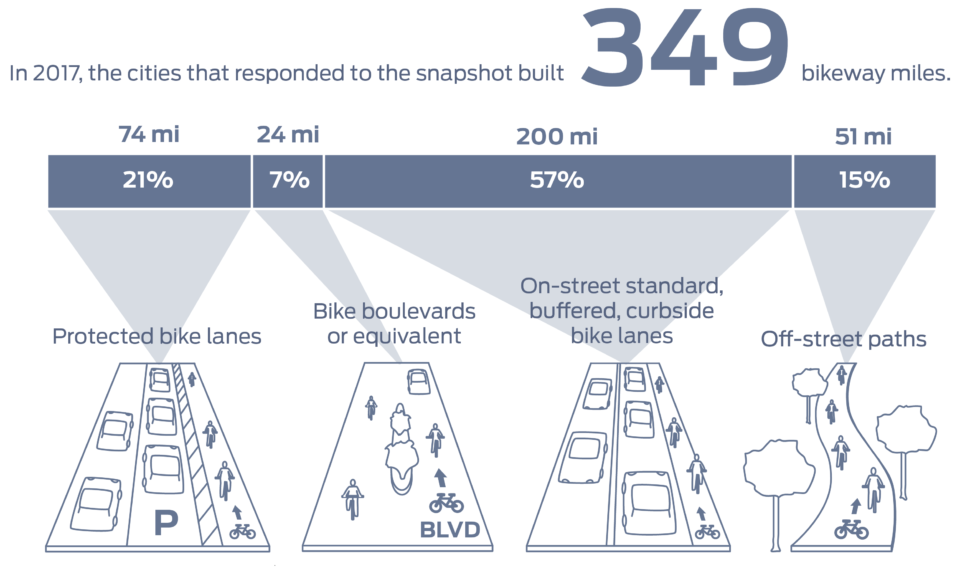
Not surprisingly, these cities had some incredible accomplishments to share. Collectively, snapshot respondents built 349 bikeway miles in 2017, bringing the total bikeway mileage across these cities to nearly 7,400. That’s well over the distance of a round-trip bike ride from Burlington, Vermont to Los Angeles, California.
These cities also installed more than 25 miles of dedicated bus lanes in 2017 and nearly a third of them have targets to implement Transit Signal Priority in coming years.
Fatality rates across the NACTO network are lower than in the U.S. as a whole. The cities who responded to the snapshot are striving to create safer streets, and built more than 2,200 projects designed to improve street safety for all road users in 2017. 80% of these cities either have a Vision Zero policy, a goal to adopt one, or a specific safety program, and two cities saw their lowest traffic fatality rates on record.
The results from this snapshot provide valuable insight into the hard work that NACTO members are doing across North America to make their cities more livable and vibrant. Over time, as we receive annual responses to the snapshot, we will be able to develop a clearer picture not just of current and recent activities, but also of trends.
NACTO thanks the 30 cities who responded to the snapshot and contributed their data to the 2017 analysis. We look forward to having even more robust data sets in future years as we continue to build out this program.
See the snapshot (pdf) >