Using the Quick Guide
In December 2023, FHWA published the 11th Edition of the Manual on Uniform Traffic Control Devices (MUTCD). In this edition, the MUTCD moves away from using the 85th percentile to set speed zones. It now requires an engineering study that considers roadway context.
Jurisdictions are able to use speed limit setting tools and methods such as expert systems and those consistent with the safe system approach as part of the required engineering study for a non-statutory speed limit.
“Speed zones (other than statutory speed limits) shall only be established on the basis of an engineering study that has been performed in accordance with traffic engineering practices. The engineering study shall consider the roadway context.”
(MUTCD Section 2B.21, paragraph 6)
First published in 2020, NACTO’s City Limits provides cities with clear technical and policy guidance on setting safe speed limits on city streets. It includes a Safe Speed Study methodology that is consistent with a safe systems approach.
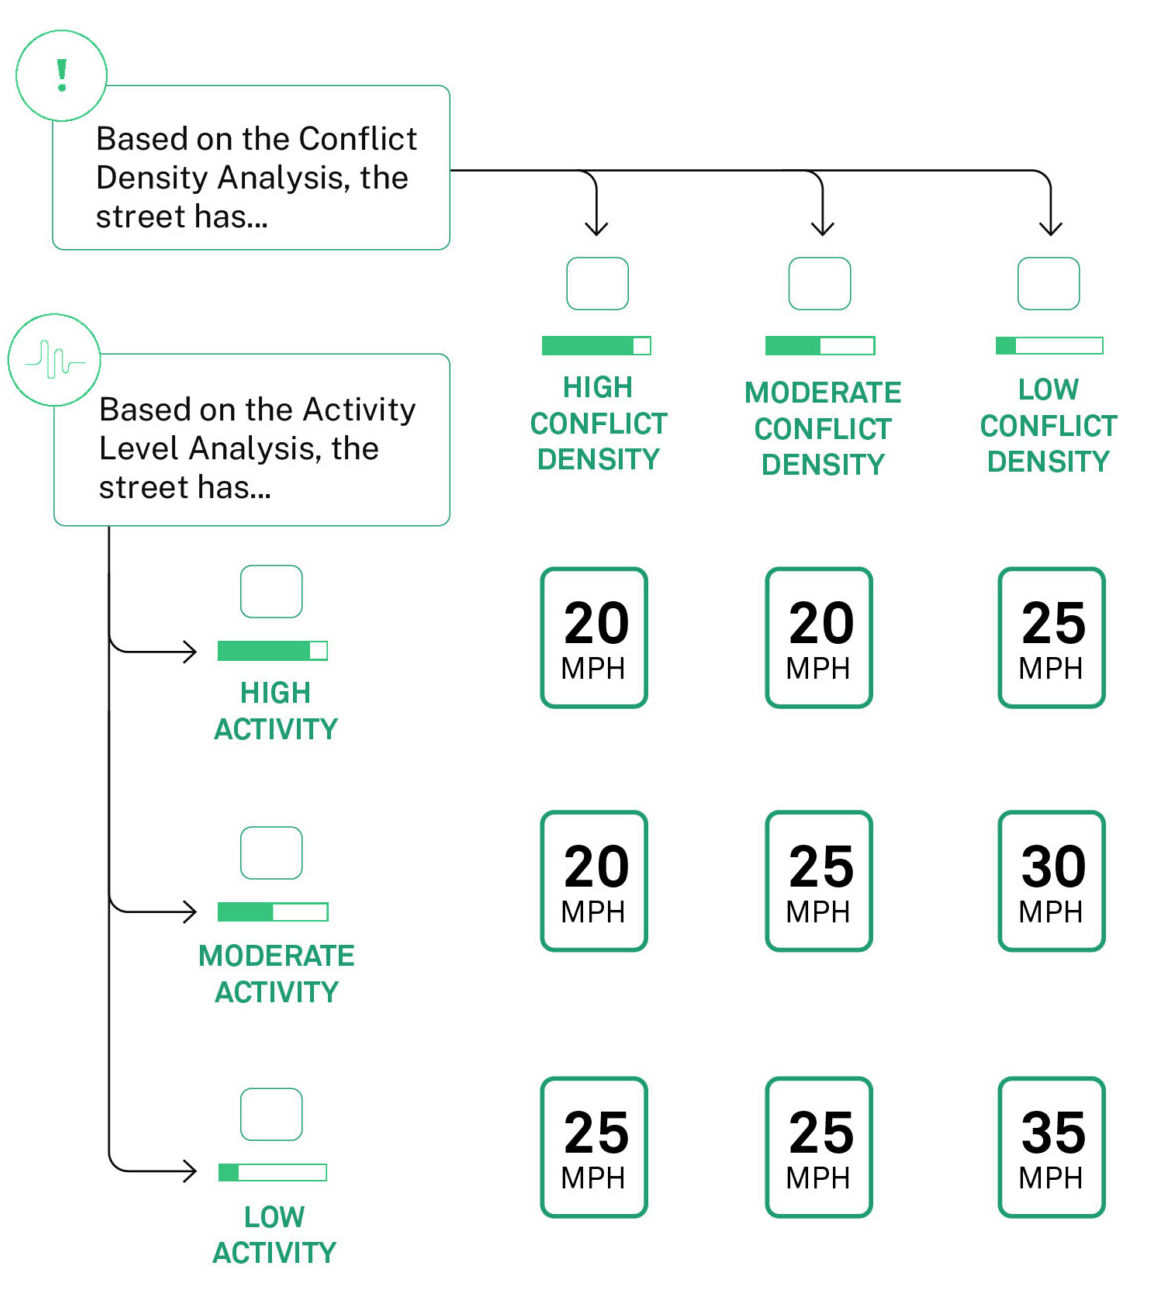
This Quick Guide demonstrates how to use the Safe Speed Study first published in City Limits. With this tool, engineers analyze a street’s activity level and conflict density in determining the posted speed limit for a speed zone. The resultant speed limit will be compliant with the MUTCD.
A Safe Speed Study is a contextually sensitive tool for engineers to use in determining a speed zone.
- The Safe Speed Study methodology analyzes conflict density and activity level, among other contextual factors, to determine the speed limit that will best minimize the risk of a person being killed or seriously injured.

Conflict Density
How frequently potential conflicts arise on a given street

Activity Level
How active a street currently is or is expected to be
- High conflict, high activity streets will require lower speed limits since the risk of a crash is high, while somewhat higher speeds can be tolerated on low conflict, low activity streets.
- To conduct a Safe Speed Study:
- Collect before data
- Analyze existing conditions
- Determine best option for speed management
- Conduct an evaluation
- This Quick Guide describes how to use the Risk Matrix to analyze existing conditions. More details are provided in the full-length City Limits.
Risk Matrix
The risk matrix is based on the idea that high conflict, high activity streets will require lower speed limits since the risk of a crash is high, while low conflict, low activity streets can tolerate somewhat higher speed limits.
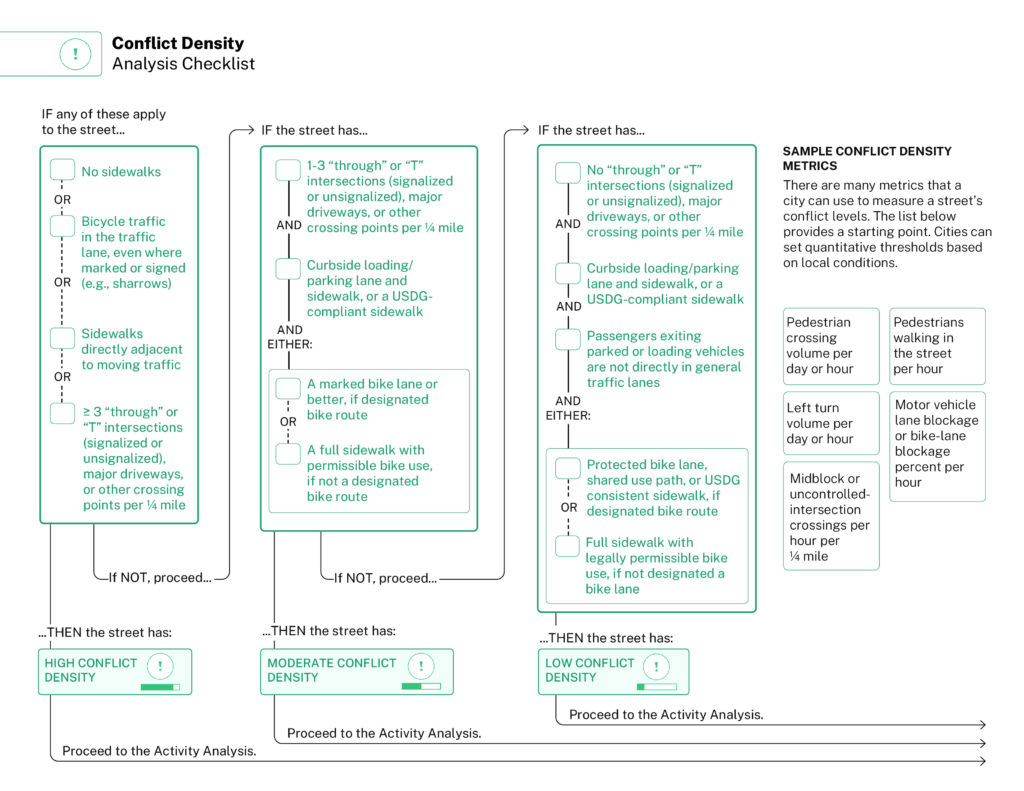
Conflict Density
Two primary factors determine conflict density: modal mixing and crossing point density.
Modal mixing: how much physical separation the street offers people walking, biking, and rolling.
High Modal Mixing
- No sidewalks or sidewalks directly adjacent to moving motor vehicle traffic
- Bicycle traffic expected to use a mixed-traffic lane or a designated shared bike/motor vehicle lane (e.g., sharrows)
Moderate Modal Mixing
- Urban Street Design Guide-compliant sidewalk, and/or a curbside loading/parking lane and sidewalk
- If designated as a bike route, a marked bike lane or better
- If not designated as a bike route, a full sidewalk that also permits bicycle use
Low Modal Mixing
- If designated as a bike route, a sidewalk compliant with the Urban Street Design Guide plus a vertically and horizontally protected bike lane, or a shared-use path/trail
- If not designated as a bike route, a full sidewalk that also legally permits bicycle use
- Passengers exiting parked or loading vehicles are not directly in motor vehicle traffic lanes
Crossing point density: how closely spaced intersections and other crossing locations are.
High Crossing Point Density
3 or more “through” or “X” intersections, “T” intersections, driveways, curb cuts, or other crossing points per ¼ mile
Moderate Crossing Point Density
1-3 “through” or “X” intersections, “T” intersections, driveways, curb cuts, or other crossing points per ¼ mile
Low Crossing Point Density
0 “through” or “X” intersections, “T” intersections, driveways, curb cuts, or other crossing points per ¼ mile
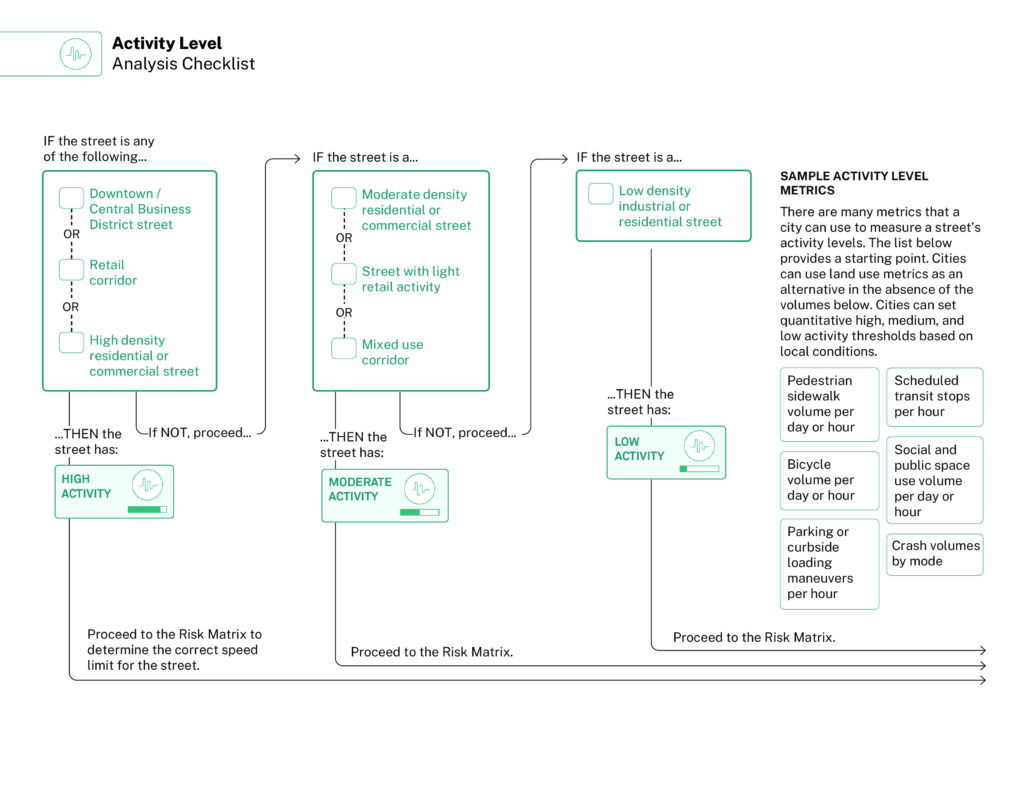
Activity Level
How active a street currently is or is expected to be.
High Activity Level
Streets with lots of existing or expected pedestrian activity, active public spaces, important bike routes or planned bike routes, high curbside demand, and high density of transit stops
- Downtown / Central Business Districts
- Retail corridors
- High density residential and commercial streets
Moderate Activity Level
Streets with moderate existing or expected pedestrian activity, moderately used public spaces, some existing or expected bike traffic, frequent driveways, curbside parking/loading, and moderate density of transit stops
- Moderate density residential and commercial streets
- Streets with light retail activity
- Mixed use corridors
Low Activity Level
Streets with minimal expected pedestrian volumes, minimal expected or planned bike activity, low curbside demand, and few, if any, transit stops
- Low density industrial and residential streets
